
Introduction
State spending on support for housing costs, which primarily relates to spending on Housing Benefit (HB) and the Housing Element of Universal Credit (UC), is set to increase substantially as we continue to recover from the economic impact of COVID-19.
Total government expenditure on support for housing costs is forecast to increase by 52% between 2000 and 2025 in real terms,[i] reaching £24.8 billion a year in 2025, mirroring the rise in spending in the early 2010s that came as a result of the global financial crisis and rising rental prices. While the relatively good economic situation of late 2010s and aggressive action to curb this expenditure, which was taken by consecutive Conservative-led Governments out of concern for deficit levels, did lead to some decrease in state spending on support for housing costs by 2020, this is set to be undone by the pandemic.
The most notable action taken to control state spending for support on housing costs in the 2010s was changing the levels of Local Housing Allowance (LHA). LHA, originally introduced in 2008, is used to calculate the entitlement of private renters receiving support for housing costs by looking at broad rental prices in a local area, to then set the maximum benchmark for how much claimants living in that area can receive. Originally set to match the 50th percentile of rental levels in a local area, this was decreased to the 30th percentile in 2011,[ii] and LHA levels were completely frozen between 2016 and 2020. As a result, the actual value of LHA has dropped below the 30th percentile in almost all areas, as private rental prices in the UK rose by 8.6% between 2015 and 2020.[iii]
Hence, in 2019, 97% of claimants who are private renters received state support that could not meet the cost of a home rented at the 30th percentile,[iv] leading to many households having to use money from elsewhere, including other benefits, to cover the shortfall. Understandably, this has put an even greater strain on the finances of low-income households, with evidence that the cuts to housing support were pulling them into relative poverty, as defined as below 60% of average household income.[v]
As part of the response to COVID-19 and the financial hardships it is placing on families, the UK Government in March 2020 increased LHA to once again match the 30th percentile of rents.[vi] However, it is intending to once again freeze LHA rates for 2021-2022.[vii]
This analysis explores how the increase in claims for state support for housing during this COVID-19 pandemic differs by each English local authority. Coupled with our last analysis piece,[viii] which explored how the increase in overall UC claims during the pandemic is distributed across different parts of the country, this allows us to paint a picture of the consequences of the pandemic on geographic inequality, specifically the Government’s ‘Levelling Up’ agenda, which is trying to better support so-called ‘left-behind’ areas in coastal towns and industrial communities.
State support for housing costs during COVID-19
To examine the scale of expansion of state support for housing costs during the pandemic, Bright Blue has combined two different sources of the latest data on state support for housing costs between February and November 2020: data from claims for HB, and data from households on UC which have a ‘housing costs element’ as part of their claim, both of which originate from official DWP data releases.[ix]
We need to rely on both datasets to assess the increase in state support for housing costs during the pandemic for several reasons. For working-age households, new claims for state support for housing costs can only be obtained by receiving the ‘housing costs element’ of UC as the introduction of UC was completed for new working-age claimants across the UK in 2018. But pensioners are still able to make a new claim for HB.
Furthermore, the non-pensioner cohort which is still claiming HB are those who have been relying on it for a long time and have not moved to UC: specifically, long-term recipients of Working Tax Credit whose circumstances have not changed for several years, the long-term unemployed and those who have a disability or a long-term health condition. There is a constant outflow of non-pensioner legacy HB claimants who are switching to UC due to a change in circumstances.
First, we quantify the change in the proportion of all households (both working-age and pension-age) in each English local authority claiming state support for housing costs in the first nine months of the pandemic, between February and November 2020.
A higher proportion of households in urban local authorities in England, especially in London, claim housing support from the state. For example, as of February 2020, just before the pandemic hit the UK, an average rural local authority had 12.2% of all households receiving state support for housing costs, as opposed to 18.8% in an average urban local authority. Similarly, while an average non-London local authority had 15.4% of all households claiming state support for housing costs, in London the average was 22.6%. This is unsurprising considering home ownership patterns , with those living in urban areas being more likely to rent.[x]
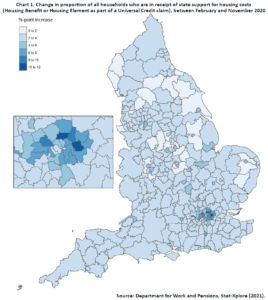
As Chart 1 below shows, this urban-rural divide in levels of all households claiming state support for housing costs has been widened further by the pandemic. The increase in the proportion of all households claiming state support for housing costs has been much more pronounced in urban areas, especially London, than rural areas. In fact, there has been, on average, a 3.7 percentage point rise in the proportion of all households claiming state support for housing costs in the average urban English local authority in the first nine months of the pandemic, as opposed to a 2.3 percentage point rise in the average rural English local authority.
London, in particular, stands out as experiencing a significant increase in the proportion of all households claiming state support for housing costs during the first nine months of the pandemic. While on average, the proportion of all households receiving state support for housing costs has increased by 2.8 percentage points across all English local authorities outside of London in the first nine months of the pandemic, this rises to an average of 5.9 percentage points in London.
We can also rank the English local authorities with the highest and lowest increases in the proportion of all households claiming state support for housing costs during the first nine months of the pandemic. Table 1 below shows the 20 local authorities in England with the highest and lowest increases in the proportion of all households claiming state support for housing costs during the pandemic, alongside the total proportion of all households in that local authority now claiming such support, as of November 2020. The final column shows the proportion of new claimants of state housing support during the first nine months of the pandemic that were renting from private rather than social landlords, which is discussed in further detail below.
Table 1: English local authorities with the highest and lowest increase in % of households claiming state support for housing costs between February 2020 and November 2020
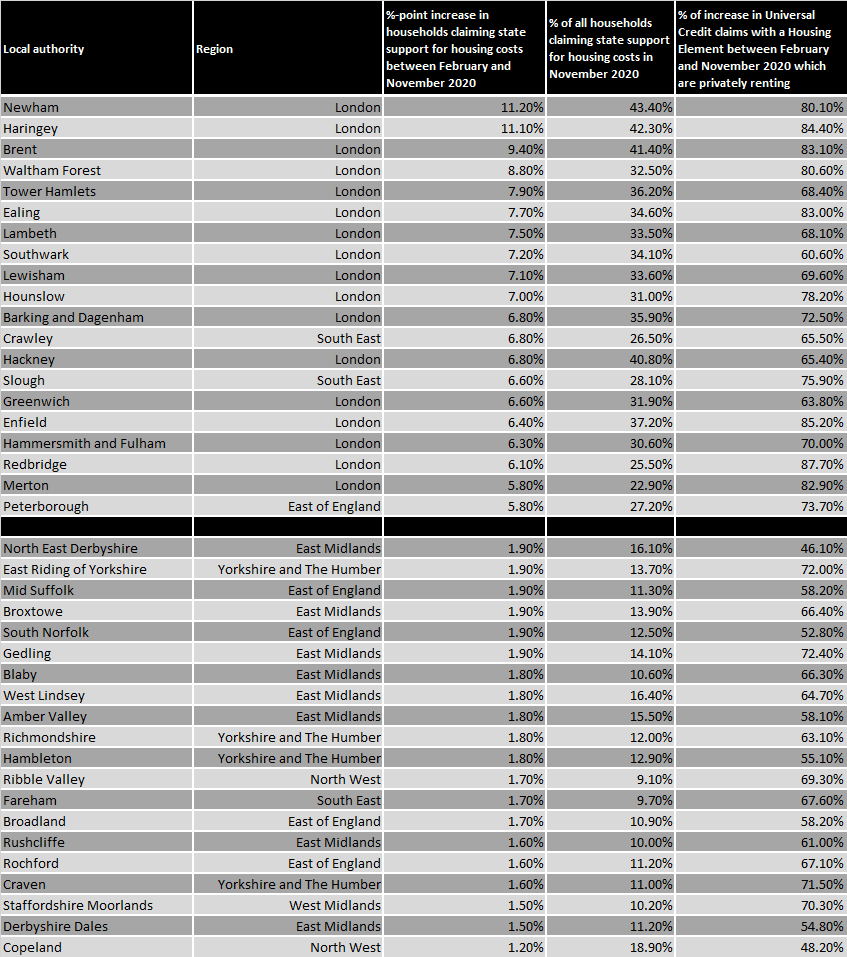
Source: Department for Work and Pensions, Stat-Xplore (2021); Office for National Statistics, Rural/urban classifications (2020).
As shown in Table 1 above, London local authorities dominate the top 20 English local authorities with the biggest increase in all households claiming state support for housing costs in the first nine months of the pandemic. Specifically, 17 of the 20 local authorities with the highest increases in all households claiming state support for housing costs were in London.
The London borough of Newham has seen the biggest increase in all households claiming housing support since February 2020, of 11.2 percentage points, meaning that in November 2020, over two in five of all households were claiming state support for housing costs. Overall, the increases in all households claiming state support for housing costs has led to a situation where in four English local authorities, all located in London (Newham, Haringey, Brent, and Hackney), a startling 40% of households or more are in receipt of state support for housing costs.
In contrast, the local authorities with the smallest increases in the number of households claiming state support for housing costs are relatively more geographically spread out and are located across various regions of England. For example, Copeland has seen only a 1.2 percentage point increase. Unsurprisingly, compared to London, these local authorities were seeing lower levels of households claiming state support for housing costs even before the pandemic, but it is important to note that the gap has now increased even further as a result of the effects of COVID-19.
State support for private renters
We now focus on the tenure of the households that have newly claimed for state support for housing costs. We can do this by analysing whether the new claimants for the housing element of UC are in private or social households, using the DWP data releases.[xi] As we are examining the new inflows of claimants, rather than the total number, we are only examining data from UC and not from HB. As aforementioned, those in the private rented sector have support capped at 30% of local rents after changes in March 2020.
The growth in claims for state support for housing costs is driven mostly by those renting privately. In February 2020, 53.3% of households on UC which received the housing element were renting socially, while 45.5% were renting privately. By November 2020, the proportion reversed, with 45.1% of households renting socially, while 53.5% were renting privately, while the number of households on UC receiving the housing element increased by more than 1.1 million, from 1.6 million to 2.8 million. The fact that most new UC claimants who are receiving the housing element of UC are renting privately is not surprising, considering that social renters are more likely to be older and out of employment.[xii] As such, they were less likely to be affected by the economic fallout from the pandemic, as the effects of COVID-19 have been more likely to affect younger employees.[xiii]
Chart 2 below displays the proportion of increase in UC claims with a housing element by each English local authority between February and November 2020 where the household is renting privately.
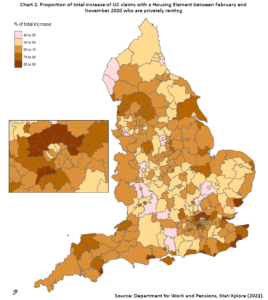
In 212 out of 317 English local authorities (66.8%), the proportion of new claimants of state support for housing costs in the first nine months of the pandemic who are privately renting is above 60%.
Many of the English local authorities where the increase has been driven overwhelmingly by private renters are the same local authorities that experienced higher increases in households receiving state support for housing costs, as shown in the final column of Chart 1 further above. This is especially the case in London.
For example, as illustrated in Table 1, Newham has seen the largest increase in households claiming state support for housing costs in the first ten months of the pandemic, at 11.2 percentage points. Concurrently, Newham is also the local authority with one of the higher proportions of private renters making up the increase in claims for state support for housing costs, at 80.1%.
Conclusion
As a result of COVID-19, the number of households claiming state support for housing costs is rising across England, particularly in London and other urban areas. Some English local authorities now have more than 40% of all households claiming such support. It is primarily those living in the private rented sector that are driving this rise in state support for housing costs claims, especially in London.
The numbers claiming state support for housing costs will naturally recede as the economy recovers from the pandemic, but forecasts suggest that spending on state support for housing costs will remain high until at least 2025.[xiv] The overall numbers claiming state support for housing costs and the total amount being spent by the government should make policymakers think deeply about the sustainability of rising state subsidies for housing costs, especially for those residing in the private rented sector. At the same time, continuing to erode the level of state support for housing costs relative to rental market prices for several years will continue to place low-income households into worse financial positions.
Anvar Sarygulov is a Senior Research Fellow at Bright Blue.
[i] Department for Work and Pensions, “Benefit expenditure and caseload tables 2020”, https://www.gov.uk/government/publications/benefit-expenditure-and-caseload-tables-2020 (2020).
[ii] House of Commons, “Local housing allowance and homelessness”, https://commonslibrary.parliament.uk/research-briefings/cdp-2019-0199/ (2019).
[iii] Office for National Statistics, “Index of Private Housing Rental Prices, UK: January 2021”, https://www.ons.gov.uk/economy/inflationandpriceindices/bulletins/indexofprivatehousingrentalprices/january2021 (2021).
[iv] Shelter, “Local Housing Allowance and Homelessness”, https://assets.ctfassets.net/6sxvmndnpn0s/4Ehd4bgEjOrTnm2HDGqcbC/0f3efd8340050906129e6f9e7acee0de/LHA_and_homelessness.pdf (2019).
[v] Joseph Rowntree Foundation, “UK Poverty 2019/20: Housing”, https://www.jrf.org.uk/report/uk-poverty-2019-20-housing (2020).
[vi] HM Treasury, “The Chancellor Rishi Sunak provides an updated statement on coronavirus”, https://www.gov.uk/government/speeches/the-chancellor-rishi-sunak-provides-an-updated-statement-on-coronavirus# (2020).
[vii] Department for Work and Pensions, “Social Security Benefit and Pension Up-rating 2021/22”, https://questions-statements.parliament.uk/written-statements/detail/2020-11-25/hcws600 (2020).
[viii] Anvar Sarygulov, “Widening chasms”, Bright Blue, https://www.brightblue.org.uk/widening-chasms-analysis/ (2021).
[ix] Department for Work and Pensions, “Stat-Xplore”, https://stat-xplore.dwp.gov.uk/webapi/jsf/login.xhtml (2021).
[x] Office for National Statistics, “UK private rented sector: 2018”, https://www.ons.gov.uk/economy/inflationandpriceindices/articles/ukprivaterentedsector/2018 (2019).
[xi] Department for Work and Pensions, “Stat-Xplore”, https://stat-xplore.dwp.gov.uk/webapi/jsf/login.xhtml (2021).
[xii] Ministry of Housing, Communities & Local Government, “English Housing Survey: Social rented sector, 2017-18”, https://assets.publishing.service.gov.uk/government/uploads/system/uploads/attachment_data/file/856046/EHS_2017-18_SRS_report_revised.pdf (2018).
[xiii] Institute for Fiscal Studies, “COVID-19 and the career prospects of young people”, https://www.ifs.org.uk/publications/14914 (2020).
[xiv] Department for Work and Pensions, “Benefit expenditure and caseload tables 2020”, https://www.gov.uk/government/publications/benefit-expenditure-and-caseload-tables-2020 (2020).