
Previous academic research has strongly suggested that two significant negative influences on levels of social integration are is higher levels of ethnic diversity and poor English proficiency of newcomers. The latter relationship is particularly unsurprising, considering that we should expect language barriers to create significant difficulties for interactions between people.
However, new research in Bright Blue’s new report, Distant neighbours? Understanding and measuring social integration in England, suggests that the effect of ethnic diversity and English language proficiency might be more complex than previously believed.
As can be seen in Table 1 below, in local areas where less than 30% of migrants cannot speak English well, higher levels of ethnic diversity in a local area are indeed associated with decreasing levels of neighbourhood trust. In such areas which are the least ethnically diverse, 40% of individuals are predicted to trust most of their neighbours, while in such areas the most ethnically diverse, only 37% of individuals are predicted to trust most of their neighbours. Here, we observe a marginal decline in neighbourhood trust as ethnic diversity increases.
Table 1. Predicted trust in a local area, by ethnic diversity and level of English proficiency of migrants
| Levels of predicted neighbourhood trust | ||
| Ethnic diversity decile | Less than 30% of migrants cannot speak English well | More than 30% of migrants cannot speak English well |
| 1 (10% least diverse areas) | 40% | 37% |
| 10 (10% most diverse areas) | 37% | 51% |
Source: Based on Citizenship Survey, pooled 2009-10 and 2010-11 (secure access) and Census 2011 data
Note: a local area is defined as a middle-layer super output area (MSOA) a standardised geographical unit used in the census which contains an average of 7,200 people
However, in local areas where more than 30% of migrants cannot speak English well, an increase in ethnic diversity is associated with a predicted increase in levels of neighbourhood trust. In local areas which are the least ethnically diverse, 37% of individuals are predicted to trust most of their neighbours, while in such areas which are also the most ethnically diverse, 51% are predicted to trust most of their neighbours.
These are surprising findings. First, the increase in ethnic diversity is associated with an increase in neighbourhood trust for this group of local areas. Second, ethnically diverse areas are predicted to have higher levels of neighbourhood trust when a greater proportion of migrants is unable to speak English well. Both of these relationships contradict the expectations borne out of previous research.
What are the plausible explanations? Our report notes of two:
- Ethnically diverse local areas with a high number of migrants who are unable to speak English well are also areas which are more likely to be residentially segregated. Those who live in residentially segregated areas are more likely to report trusting neighbours, as their immediate neighbourhoods are formed of people who are similar to them
- Ethnically diverse local areas with a high number of migrants who are unable to speak English are ‘super-diverse’, where people are more used to immigration, ethnic diversity and dealing with people who do not speak English well, making it easier to form relationships even across language barriers
To examine these explanations, we should consider the local authority Sandwell.
Sandwell is a metropolitan borough in West Midlands, located immediately west of the City of Birmingham. Across the entire local authority, 35.5% of migrants describe themselves as unable to speak English well, or worse, when asked about their English proficiency. This tendency is distributed evenly across the borough, with 24 out of 38 local areas having this proportion at 30% or above. Sandwell also has an Ethnic Diversity Index of 0.50, putting it in the 9th decile for ethnic diversity in England. Once again, the local areas of Sandwell are also overall diverse, with 19 out of 38 being in the 9th or 10th decile of ethnic diversity and no local area being placed lower than the 6th decile.
It is also important to note that according to the independent statistical analysis in our report, Sandwell has a predicted trust level of 24.2%, putting it in the bottom decile for predicted trust in local authorities. As the statistical analysis accounts for a large number of other properties, such as socio-demographic profile of individuals and other area factors such as deprivation, this suggests that despite Sandwell being both very ethnically diverse and having a high proportion of migrants who cannot speak English well, the combined positive effect of this on trust is insufficient to counter-balance the negative effect of other factors.
First, let’s examine the state of residential segregation in Sandwell. Sandwell’s Index of Dissimilarity, a widely used measure for residential segregation, is 43.4, which places it in the 10% most segregated local authorities in England. This can also be observed visually by examining the distribution of ethnic groups across the local authority.
Figure 1 illustrates the two biggest ethnic groups in the local authority: White British (65.8% of local authority population) and Asian British Indian/Asian Indian (10.2%). We can clearly observe a pattern of residential segregation in the local authority when looking at these figures side by side; while White British population is above 75% in the majority of southern and northern sections, it falls below 50% in the majority of the centre of Sandwell. The pattern for Asian British Indian/Asian Indian group is a complete inversion: above 15.6% in most of the central section, but below 2.2% in many of the northern and southern areas of Sandwell.
Figure 1. Distribution of White British (left) and Asian British Indian/Asian Indian (right) in Sandwell, 2011
Source: Datashine, Census 2011 and Office for National Statistics
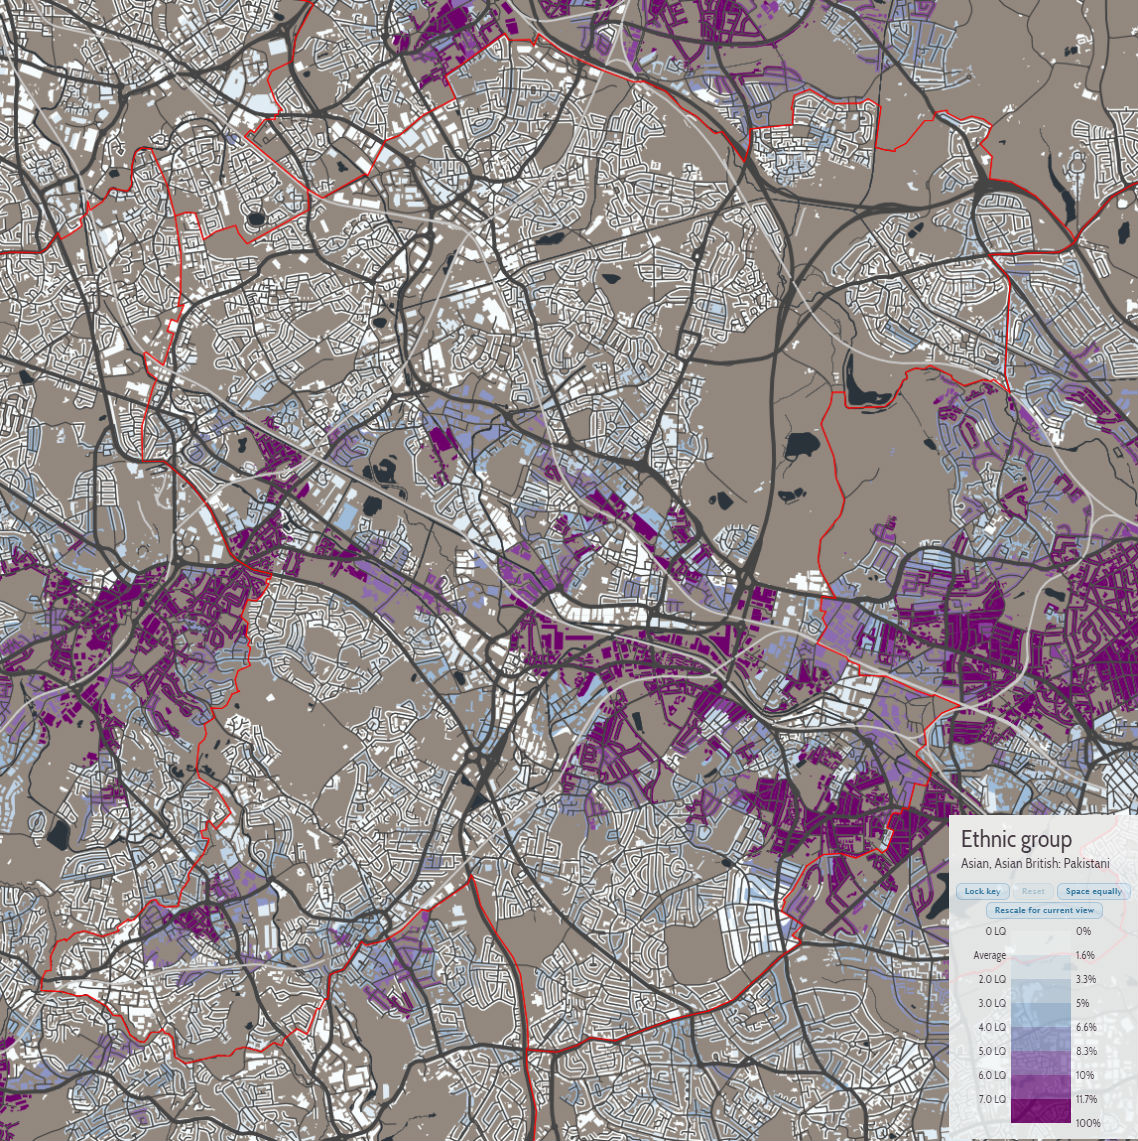
Figure 2 below illustrates the third and fourth biggest ethnic group: Asian British Pakistani/Asian Pakistani (4.5%) and Black British Caribbean/Black Caribbean (3.7%), mainly to highlight that this pattern is not exclusive to one ethnic group, with both of these ethnic groups also clustered primarily in the centre of Sandwell. The presence of significant residential segregation provides support for the first explanation in our recent report, as despite living in an ethnically diverse areas, many also live alongside neighbours who are very similar to them.
Figure 2. Distribution of Asian British Pakistani/Asian Pakistani (left) and Black British Caribbean/Black Caribbean (right) in Sandwell, 2011
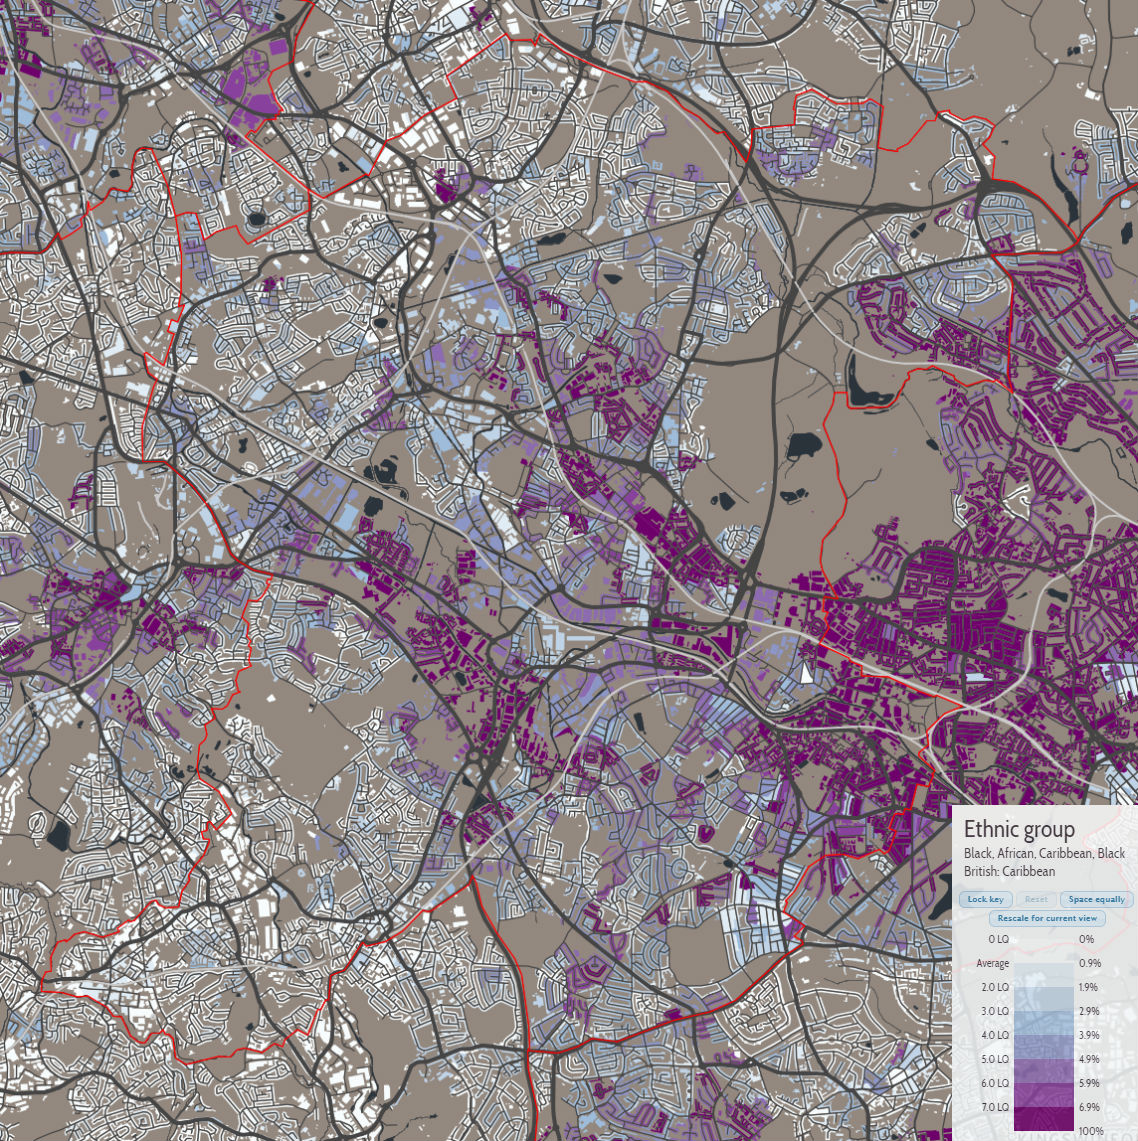
Source: Datashine, Census 2011 and Office for National Statistics
Furthermore, Table 2 below shows the results in the 2005 and 2010 general elections for the British National Party (BNP). As can be seen, in the Sandwell constituencies where BNP stood in 2005 and 2010, BNP performed above the national average, while the rank of performance indicates that these constituencies were some of the best performing for BNP.
Table 2. BNP vote share at general elections in Sandwell constituencies
| Constituency | 2005 | 2005 rank of performance | 2010 | 2010 rank of performance |
| Warley | 5.5% | 26/119 | Did not stand | N/A |
| West Bromwich East | 6.6% | 16/119 | 5.8% | 50/339 |
| West Bromwich West | 9.9% | 4/119 | 9.4% | 5/339 |
| Halesowen and Rowley Regis* | Did not stand | N/A | Did not stand | N/A |
| National average (in constituencies where BNP stood) | 4.3% | 3.8% |
*Partly in Sandwell, partly in Dudley
The success of BNP raises questions about the viability of the second explanation. As noted by previous research, support for BNP is associated with considerable anxiety about immigration and perceptions of conflict between the White British and minorities which are predominantly Muslim. Hence, Sandwell appears unlikely to be a place where there is a general attitude of being used to immigration, ethnic diversity and dealing with people who do not speak English well, as the disproportionate support for BNP indicates very much the opposite.
The above evidence should only be taken as indicative. Further analysis, either statistical or qualitative, is necessary to establish the most likely explanation to our peculiar findings. However, the evidence mentioned suggests that the positive relationship between neighbourhood trust and lack of English proficiency is probably masking a more troubling and concerning effect, such as residential segregation.
Anvar Sarygulov is a researcher at Bright Blue