Category

Welfare

Annabelle Walker: Childcare needs more than just demand side reform

By Centre Write, Education, Health & Social Care, Politics, Towns & Devolution, Welfare

The childcare crisis in the United Kingdom is more than just a pressing social issue; it’s a ticking time bomb with profound economic repercussions. The UK’s broken childcare system is an epidemic that has significant negative impacts on UK economic productivity and exacerbates the gender pay gap. Whilst initial progress has been made to address the crisis, specifically increasing demand for childcare, more needs to be done to address shortfalls in supply.

The astronomical cost of childcare has forced one in four UK parents to quit their jobs or drop out of education. This issue is highly gendered, with women predominantly bearing the brunt of unpaid domestic labour and childcare responsibilities. Consequently, women face a widening gender pay gap amid the relentless cost of living crisis. Bridging the gender gap could generate an extra £150 billion in GDP by 2025, with childcare provision playing a crucial role in unlocking this potential.

Additionally, investment in early childhood education (ECE) yields significant long-term socioeconomic benefits. Indeed, children who receive high-quality ECE are 14% more likely to be employed as adults, earn higher annual incomes, and can indirectly lower the likelihood of individuals engaging in criminal activities. Advancements in social mobility caused by ECE clearly highlight the need for a fully-functioning childcare system. 

Earlier this year, the UK government announced a £4 billion childcare reform package in response to the childcare crisis. The reforms included various initiatives such as the Extended Early Years Free Entitlement program, which grants children under three 15 hours of weekly free childcare, increasing to 30 hours per week by 2025. Additionally, the Government are attempting to incentivise new childminders with a £600 sign-up bonus to bolster recruitment in the childcare industry. 

Whilst these reforms are a step in the right direction, they largely fail to address the rapidly declining supply of childcare providers. It is imperative that the Government address this issue, as focusing solely on increasing demand for free childcare will create a chasm between expectations and capacity.

According to a nationwide survey by the Early Years Alliance, a substantial portion of childcare providers plan to offer only a limited number of places under the Government’s scheme for free childcare and charge privately for the rest. Eighty-three percent of providers expect an increase in demand under the new scheme, yet 60% will not be increasing the number of places they offer. This highlights the scheme’s fundamental flaw: demand is increasing, yet supply is not.

Supply is decreasing. There is a critical shortage of qualified childminders, with the number of registered childminders in England declining by 11% in just one year – falling to their lowest number since 2012. Ofsted data shows this results in a loss of more than 20,000 childcare places per annum

The number of staff employed by voluntary organisations and school-based nurseries is also declining. Childcare professionals are not accepting children eligible for government-funded care due to insufficient government payment. The only childcare providers to increase staffing between 2019 to 2022 were private nurseries, raising serious concerns regarding the perpetuation of socioeconomic disadvantage, given the benefits of ECE.

Ultimately, the financial viability of running a childcare business, coupled with low pay, increasing workloads and the cost of living crisis, is driving professionals away from the sector. Experts, such as Neil Leitch from Early Years Alliance, worry that government efforts to attract new childminders, such as sign-up bonuses, are unlikely to stem the exodus of existing professionals, and risk de-professionalising the workforce. 

To successfully tackle the childcare crisis, it is vital to increase the number of childminders and the capacity of existing providers. Expanding the workforce is the only way to bridge the supply-demand gap, increasing childcare provider participation in the Government’s currently ineffective childcare scheme. 

Boosting the workforce can be achieved in two ways. 

Firstly, recruitment of qualified childcare providers. Promoting early childcare careers to graduates via accessible Teach First style training programmes directly increases the size of the workforce. Germany’s ECEC training programme provides paid employment alongside the equivalent of a bachelor’s degree in vocational training for childcare. Hugely successful, the initiative attracts more applicants than places, highlighting the effectiveness of training programmes in recruitment. These programmes simultaneously increase the quality of ECE. Childcare providers with graduate and Level 3 qualified staff are shown to score highly on quality measures including learning, literacy, and language, and tend to be the most highly graded childcare settings. 

The second way to increase the workforce is by incentivising qualified workers to stay in the industry. To retain existing professionals, the Government should increase funding to match the increasing costs of providing childcare services. Currently, the Government pay professionals less than two-thirds of the estimated cost of the provision of free childcare. 

Furthermore, the Government must provide employees with professional development opportunities. Multiple countries have implemented effective strategies that retain qualified workers within the childcare sector. Slovenia’s early childcare system promotes preschool teachers to various titles, which correlates with pay rises. Promotion is based on years of experience, performance at work and engagement in additional professional development activities. Staff who are engaged, feel valued and can fulfil career ambitions are more likely to remain within their sector. The UK government should investigate implementing a similar model to decrease the mass departure from the UK’s childcare industry.

Therefore, childcare reforms must target the growth of childcare suppliers. Only by  increasing the supply of childminders and the capacity of existing providers can the UK fully resolve the childcare crisis, unlocking the untapped economic potential of parents who currently have no choice but to stay at home.

Annabelle Walking is currently doing work experience at Bright Blue. Views expressed in this article are those of the author, not necessarily those of Bright Blue. [Image: Arron Burden]

Anvar Sarygulov: Beyond the safety net? Informal sources of support for Universal Credit claimants during the COVID-19 pandemic

By Anvar Sarygulov, Centre Write, Welfare

Introduction

The COVID-19 pandemic, and the national effort to contain it, have led to significant economic disruption, affecting the income of millions of people. To protect their finances, the UK Government introduced several interventions, including increasing the value of a number of working-age benefits.

A key component of this increase was the ‘uplift’ to Universal Credit (UC) and Tax Credits, with most existing and all new working-age benefit claimants seeing a weekly £20 increase in their benefit payments, which is scheduled to be fully withdrawn on 6 October.

Our previous research[i] has shown that despite these increases in working-age benefits, a significant minority of Universal Credit claimants have found it difficult to manage financially during the pandemic, including struggling with their regular household bills and housing payments. 

The state, of course, is not the only source of financial support for those in financial hardship. Another major provider of support is family and friends. This new analysis examines use of those informal sources of financial support to which Universal Credit claimants turn to.

Methodology

Bright Blue has used survey data from the Understanding Society COVID-19 Study[ii] to perform original analysis examining changes in the financial situation of UC claimants relative to the rest of the population during the first year of the pandemic.

The Understanding Society COVID-19 Study conducts surveys at specific intervals, with questions varying between different survey waves. The months during the pandemic used in the analysis (May 2020, July 2020, November 2020 and March 2021) were chosen on the basis of availability of data on answers to questions of interest.

All survey data has been weighted to be representative of the adult population of the United Kingdom. 

We focus on two population groups: those who do not claim Universal Credit (‘non-UC respondents’, or the ‘rest of the population’), and those who are claiming Universal Credit or are applying for it in the month of the survey (‘UC respondents’). Unweighted sample sizes for each group and each time period are shown in Table 1 below, alongside the total number of UC claimants in the United Kingdom in that month.

Table 1. Unweighted sample sizes of each group of interest and total number of UC claimants in the UK in that month

Time Non-UC UC Total number of UC claimants in the UK
May 2020 14262 549 5,260,000
July 2020 12635 537 5,512,000
November 2020 11328 494 5,789,000
March 2021 11806 603 5,972,000

Informal financial support

We begin by examining the proportion of UC claimants and the rest of the population who received informal financial help during the first year of the pandemic, as shown in Chart 1 below. 

We find a notable minority of UC respondents were receiving financial help from their family and/or friends throughout the first year of the pandemic. While the number of non-UC respondents reporting receiving help from family and/or friends remained steady between 4% and 5% during the first year of the COVID-19 pandemic, UC claimants were much more likely to receive such help throughout the first year of the pandemic, with 23% of claimants receiving such help in May 2020, rising to 25% in July 2020, before falling slightly to 19% in November 2020 and 17% in March 2021. This means that near the start of the pandemic, a quarter of all UC claimants were receiving financial help from family and friends, which would represent 1,378,000 claimants. By March 2021, this falls to an expected 1,015,000 UC claimants.
Next, we examined the specific person that provided informal financial help. The results for near the start and after one year of the pandemic are illustrated in Table 2 below.

Next, we examined the specific person that provided informal financial help. The results for near the start and after one year of the pandemic are illustrated in Table 2 below.

Table 2. Specific source of support mentioned by UC respondents who reported receiving financial help from family and/or friends

Source May 2020 March 2021
Parents 57% 72%
Adult children 33% 13%
Friends 26% 14%
Siblings 18% 10%
Neighbours 8% 4%


The most common source of financial help for UC respondents, as seen in Table 2 above, are parents, with a clear majority of 57% of UC respondents who received informal financial help mentioning parents in May 2020 and 72% in March 2021. This is followed by adult children, with about a third (33%) mentioning them as the source of informal financial help at the start of the pandemic in May 2020, falling to 13% in March 2021. After a year of the pandemic, parental support became an even more common form of support, with nearly three quarters of those receiving informal financial help relying on their parents.

We then examined the proportion of respondents giving financial help to family and/or friends, as shown in Chart 2 below. 

Notably, UC respondents were almost as likely as non-UC respondents to give financial help to family and/or friends during the pandemic as the rest of the population, despite having lower income. The number of both non-UC and UC respondents who gave financial help to family and/or friends during the first year of the COVID-19 pandemic remained relatively steady between May 2020 and March 2021. Between 13% and 16% of non-UC respondents reported providing such help during the first year of the pandemic. Similarly, between 11% and 14% of UC respondents reported giving financial help to family and/or friends during the first year of the pandemic. This would mean that in March 2021, we would expect around 780,000 UC claimants across the whole UK to be providing at least some financial help to family and/or friends.

We also looked at the types of recipients mentioned by UC respondents who reported giving financial help. The results for near the start and after one year of the pandemic and displayed in Table 3 below.

Table 3. Types of recipients mentioned by UC respondents who reported giving informal financial help to family and/or friends

Recipient May 2020 March 2021
Parents 40% 32%
Adult children 21% 36%
Friends 32% 19%
Siblings 8% 18%
Neighbours 22% 15%


Interestingly, at first, parents are more likely to be recipients of financial help from UC claimants among those giving such support to family and/or friends, with 40% of those giving informal help reporting this in May 2020 and only 21% reporting adult children. After a year of the pandemic, however, this reverses and adult children are slightly more likely to be recipients of UC claimants giving informal financial help, with 36% of claimants who give reporting adult children as recipients and 32% reporting their parents in March 2021. 

Finally, we also explained the proportion of UC and non UC respondents who reported both giving to and receiving from family and/or friends. This shows the extent of a wider informal network providing financial help to one another during the pandemic, as shown in Chart 3 below.

It should be noted that a small but notable proportion of individuals have both received from and given to family and/or friends, with this more likely among UC respondents. While between 1% and 2% of non-UC respondents reported both receiving from and giving to family and/or friends in the first year of the pandemic, this rises to between 4% and 6% for UC respondents. Considering 6% of UC respondents reported both receiving from and giving to family and/or friends after the first year of the pandemic, this would mean that in March 2021, we would expect around 240,000 UC claimants across the UK to be both receiving from and giving to family and/or friends.

Conclusion

Our analysis shows that significant minorities of UC claimants have received informal financial support during the first year of the pandemic, despite the strengthening of the safety net that has happened in March 2020. 

Though the proportion of UC claimants receiving financial help from those close to them has declined slightly during the first year of the pandemic, it has remained relatively high, with an expected more than a million UC claimants receiving it in March 2021. Hence, while the majority of UC claimants are managing their finances without informal sources of help, and some are even providing financial help to others close to them despite being on low income themselves, there are still over a million UC claimants who are relying on informal sources of support. Despite the financial pressures they are facing, after a year of the pandemic, UC claimants were as likely as the rest of the population to be giving informal financial help to those close to them.

The full removal of the uplift, scheduled for 6 October, will lead to an average income loss of 5% for households receiving Universal Credit. This sudden withdrawal is very likely to lead to an increase in the number of UC claimants seeking informal sources of financial support. 

References

[i] Anvar Sarygulov, “Benefit to all? Financial experience of Universal Credit claimants during the pandemic”, Bright Blue, http://www.brightblue.org.uk/benefit-to-all/ (2021).

[ii] University of Essex, Institute for Social and Economic Research. Understanding Society: COVID-19 Study, (2021). [data collection]. 4th Edition. UK Data Service. SN: 8644, 10.5255/UKDA‐SN‐8644‐4.


[Image: Tierra Mallorca]

Phoebe Arslanagic-Wakefield: Under stress? The experiences of benefit claimants during the pandemic

By Centre Write, Economy & Finance, Phoebe Arslanagic-Wakefield, Welfare

Introduction

Many people have had to lean on the social security system during the pandemic, some for the first time — the number of people claiming Universal Credit increased by 98% between January 2020 to June 2021 to six million.[i]

Pandemic-era research[ii] has already found that many benefit claimants have experienced serious economic stress since the pandemic struck, despite the Government’s temporary £20 uplift for those claiming Universal Credit and Working Tax Credit.[iii] For example, recent Bright Blue analysis[iv] found that significant minorities of Universal Credit claimants reported not being up to date with household bills and housing payments throughout the pandemic,[v] with a significant minority also reporting finding it difficult to manage financially throughout the pandemic. 

As part of Bright Blue’s ongoing project examining the inequalities of home working during the pandemic, we investigated differences in the experiences of benefit claimants and the rest of the public in the first year of the pandemic.

Our analysis uncovers two types of experience during the pandemic where significant differences between benefit claimants and the rest of the public emerge: financial and relational. 

Methodology

Polling was undertaken by Opinium and conducted between 19th and 26th February 2021. It consists of one sample of 3,003 UK adults, with 1,053 respondents who are benefit claimants and 1,950 respondents who are not benefit claimants. Benefit claimants refers to those receiving at least one benefit, such as Universal Credit or Disability Allowance. The sample was weighted by Opinium to reflect a nationally representative audience.

Financial

Benefit claimants are significantly more likely than the rest of the public to report having to dip into their savings to cover daily expenses over the first year of the pandemic, as can be seen in Chart 1 below. 

Chart 1. Views of the UK public on whether they have had to dip into their savings to cover daily expenses or not since March 2020, by benefit claimant status.

Base: 3,003 UK adults

While a majority of 52% of benefit claimants report having to dip into their savings to cover daily expenses over the first year of the pandemic, a minority of 29% of the rest of the public report the same. Indeed, the majority of the rest of the public (67%) report not having to dip into their savings to cover daily expenses since March 2020.

Benefit claimants are not only more likely than the rest of the public to report being forced to erode their savings in order to afford daily expenses over the course of the first year of the pandemic, but also to have to borrow more money to cover these daily expenses, as is demonstrated in Chart 2 below.

Chart 2.  Views of the UK public on whether they are borrowing more, the same amount as before, or less money to cover daily expenses since March 2020, by benefit claimant status.

Base: 3,003 UK adults

Though a plurality of benefit claimants report that they did not have to borrow money to cover daily expenses before March 2020 and still did not after a year (46%), over a quarter do report having to borrow more money to cover daily expenses (28%) over the first year of the pandemic. Fifteen percent report borrowing the same amount of money as before and 7% report borrowing less. 

In contrast, a firm majority of 79% of the rest of the public report that they did not did not have to borrow money to cover daily expenses before March 2020 and still do not, with only a small minority of 7% of them reporting that they have had to borrow more money during the first year of the pandemic. Seven percent of the rest of the public report borrowing the same amount of money as before and 4% report borrowing less.

In summary, benefit claimants appear to have been more significantly impacted by the pandemic financially than the wider public: they have been at a higher risk of being forced to lean on their savings and to borrow more money simply to be able to cover daily expenses over the first year of the pandemic.

Relational

Disturbingly, we also found a marked difference between benefit claimants and the rest of the public in terms of their likelihood of experiencing domestic abuse since the pandemic began. We focus on this as some evidence has emerged that lockdown measures have seen the incidence and intensity of domestic abuse increase.[vi]

Asked whether, since March 2020, they have experienced domestic abuse, our polling shows that benefit claimants report experiencing domestic abuse during the first year of the pandemic at a much higher rate than the rest of the public, as is shown in Chart 3 below.

Chart 3. Views of UK adults on whether they have experienced domestic abuse since March 2020, by benefit claimant status.

Base: 3,003 UK adults

Though a clear majority (80%) of benefit claimants report that they have not experienced domestic abuse since March 2020, 12% of report that they have and 6% report that they have not but are concerned that they may. 

In comparison, 94% of the rest of the public report that they have not experienced domestic abuse, 1% report that they have and 3% that they have not but are concerned that they may. 

This means that there is a 14-percentage point difference between benefit claimants and the rest of the public in having experienced or been at serious risk of domestic abuse during the first year of the pandemic.

Previous research shows that those in lower income groups are at a higher risk of domestic abuse. Though benefit claimants are a diverse and broad group, the link between lower incomes and a higher risk of domestic abuse may in part explain what we have found: that benefit claimants have been at a disproportionate risk of domestic abuse during the pandemic in comparison with the rest of the public.

Conclusion 

In providing insight into particular aspects of the financial and relational experiences of benefit claimants during the pandemic, our polling analysis puts a spotlight on how they have experienced the first year of the pandemic differently to the rest of the public. 

We have found that not only have benefit claimants been at a higher risk of experiencing domestic abuse during the first year of the pandemic, but that the pandemic has acted to undermine their financial resilience.

Notes

The relevant data tables for the polling can be found here

We are grateful to Opinium for advising on and carrying out the survey, and to Barrow Cadbury Trust and Trust for London whose sponsorship have made this work possible. Barrow Cadbury Trust and Trust for London do not necessarily endorse this analysis, over which Bright Blue retains complete editorial control.


References 

[i] ONS, “Universal Credit statistics, 29 April 2013 to 10 June 2021”, https://www.gov.uk/government/statistics/universal-credit-statistics-29-april-2013-to-10-june-2021 (2021).


[ii] Patrick Butler, “One in six new universal credit claimants forced to skip meals”, The Guardian, 19 February, 2021.


[iii] K. Summers et al., “Claimants’ experiences of the social security system during the first wave of COVID-19”, Welfare — At A Social Distance and Economic and Social Research Council (2021).


[iv] Anvar Sarygulov, “Benefit to all? Financial experience of Universal Credit claimants during the pandemic”, Bright Blue, http://www.brightblue.org.uk/benefit-to-all/ (2021).


[v] “New projects”, Bright Blue, http://www.brightblue.org.uk/research/.


[vi]  Ryan Shorthouse and Phoebe Arslanagić-Wakefield, “Domestic abuse is everyone’s business”, ConservativeHomehttps://www.conservativehome.com/platform/2021/02/ryan-shorthouse-and-phoebe-arslanagic-wakefield-domestic-abuse-is-everyones-business.html (2021); ONS, “Domestic abuse in England and Wales overview: November 2020”, https://www.ons.gov.uk/peoplepopulationandcommunity/crimeandjustice/bulletins/domesticabuseinenglandandwalesoverview/november2020 (2020).


[Image: Engin Akyurt]

Zoë Shipton: Mandatory Reconsideration – a barrier to social security?

By Centre Write, Welfare

In 2013, the Department for Work and Pensions introduced Mandatory Reconsideration (MR), a mechanism to review and correct benefit assessments should a claimant wish to challenge a decision. This essentially amounts to an appeal process internal to the DWP.  Prior to 2013, a claimant would have been able to go directly to HM Courts and Tribunals Service to lodge an appeal.

The introduction of MR in 2013 appears to have had only negative consequences. The benefits process, already fraught with long wait times and complex forms, has become more burdensome for claimants. To apply for social security, claimants must have internet access, and an adequate level of digital literacy. These are essential to the process but should not be assumed available to everyone. Bright Blue research has found that even claimants with a good level of digital literacy have struggled with some elements of the online process. MR, for most, is yet another step in a long-drawn-out process. 

Advocacy groups have branded MR as not fit for purpose, citing negative and frustrating experiences of claimants as reflective of a ‘broken system’. One claimant, who had her initial assessment decision overturned at tribunal appeal, did so after scoring 36 points, where the threshold for entitlement was 15. This claimant only went to tribunal after receiving a ‘rubber stamp’ MR result that left the original assessment decision unchanged. The points system used for Employment and Support Allowance, which this claimant was applying for, measures someone’s capacity to physically work, and includes indicators such as an individual’s ability to walk 50 metres.  On the face of it, it seems absurd that a candidate scoring 36 points was turned down initially. 

In 2018, only 20% of decisions were reversed through MR. The percentage of claimants who had their decision reversed at tribunal was far higher, at 69%. More recently, the charity Scope highlighted data showing that 72% of assessment decisions were reversed at tribunal, having failed to be reversed through MR. These figures, already worrying, would likely be higher if more people had the necessary support to make it through MR to reach the tribunal. 

Given the high number of decision reversals at tribunal, MR clearly fails its defined purpose of properly reviewing assessment decisions. This raises the question of whether it is necessary to have MR at all. If initial assessments were fair and accurate, fewer appeals would need to be lodged. More importantly, supposing that a large proportion of claimants do not make it to tribunal, MR may be an unfair roadblock. After all, the DWP’s own research shows that two in five claimants who did not go to tribunal after an MR, chose not to because they found the process too stressful. 

Indeed, sceptical tribunal judges have argued that the MR process has turned into nothing more than an “additional administrative barrier for claimants who wish to challenge their decision rather than a substantive re-examination of the evidence”. This accusation is supported by the data mentioned above, which illustrates the enormous gulf between the MR outcomes and those seen at tribunal. 

The situation appears to be worsening as a result of Covid-19, with several citizens advice organisations citing MR as an area of real concern, with worries that it has been “de-prioritised”, and claimants feeling that their MR applications have been “pushed to the back of the queue”. 

Although it is fair to say that the DWP will have been severely stretched by the pandemic, the wait time for some MR decisions is already estimated at several months from the point of submission. The possibility that this waiting time is now increasing is of grave concern. 

According to the DWP, MR was introduced to reduce the demand on HMCTS and to resolve disputes as early as possible, instead they may actually be causing further delay. Other organisations disagree that this was the rationale, suggesting that MR was actually introduced to remedy the flawed initial assessments for claimants and to redress the volume of incorrect refusals. 

If MR has become an unnecessary and unfair hurdle to benefit claimants, then the DWP must listen to the practical advice offered to them by advocacy organisations, who call for an extension of the deadline for MR requests, and more time and training for MR decision makers. 

This approach, however, might ignore by far and away the most crucial point for revision: to make initial assessments as fair and accurate as possible, thus avoiding the need for either MR or tribunal from the onset. In practical terms, this would also mean diverting money away from some of the costly components of the tribunal process. In 2015, the DWP spent £22 million on ‘presenting officers’. This spending, advocacy groups argue, is a misuse of taxpayer money, and should be re-focused into making the correct assessment decisions initially. 

In light of the above evidence, the DWP must take definitive action to improve the MR system. The statistics show that MR is not only ineffective, but acts as a significant barrier to social security. If the DWP fails to reallocate time and resources into ensuring MR fulfills its intended purpose, then it must seriously consider the removal of MR from the benefits system altogether. 

Zoë is currently undertaking work experience at Bright Blue. Views expressed in this article are those of the author, not necessarily those of Bright Blue. [Image: Christophe Meneboeuf]

Anvar Sarygulov: Benefit to all? Financial experience of Universal Credit claimants during the pandemic

By Anvar Sarygulov, Centre Write, Welfare

Introduction

As the COVID-19 pandemic hit the UK in March 2020, the Government made an unprecedented intervention to support the incomes of households through increases in various working-age benefits and provision of job retention income support. 

A major component of this was the ‘uplift’ to Universal Credit (UC) and Tax Credits, with most existing and all new working-age benefit claimants seeing a weekly £20 increase in their benefit payments. The provision of this uplift was extended several times over the last year or so as the pandemic continued, but it is now expected that the uplift will be withdrawn fully at the end of September 2021. 

Evidence suggests that the COVID-19 pandemic has had a much greater negative economic impact on lower income households: they were more likely to face reductions in income, more likely to have to dip into savings[i], and more likely to accumulate debt.[ii]

This analysis focuses in particular on the financial impact of the pandemic on existing and new UC claimants relative to the rest of the public. We examine several objective measurements of financial security such as debt levels and households bills, as well as more subjective measures.

Methodology

Bright Blue has used survey data from the Understanding Society COVID-19 Study[iii] to perform original analysis examining changes in the actual and perceived financial situation of existing and new UC claimants relative to the rest of the population during the first year of the pandemic.

The Understanding Society COVID-19 Study conducts surveys at specific intervals, with questions varying between different survey waves. The months during the pandemic used in the analysis (May 2020, July 2020, November 2020 and March 2021) were chosen on the basis of availability of data on answers to financial questions.

Where possible, we have also included a comparison with responses to questions before Covid-19 hit, from the 2018-19 UK Household Longitudinal Study[iv], to illustrate the extent of change in the perceived and actual financial situation during the pandemic. However, as will be clear later in this analysis, two questions  – on debt levels and on future perceptions of finances – did not have an appropriately similar question in 2018-19 for comparison purposes.

All survey data has been weighted to be representative of the adult population of the United Kingdom. 

We examine three population groups: those who do not claim Universal Credit (‘non-UC’), those who were claiming Universal Credit in February 2020 (‘existing UC’), and those who began to claim Universal Credit in March 2020 or later (‘new UC’). While the non-UC group could include some claimants of other working-aged benefits, this group does provide a benchmark for how the broad population has been affected by the pandemic in terms of their perceived and actual financial situation. Unweighted sample sizes for each group and each time period are shown in Table 1 below.

Table 1. Unweighted sample sizes of each group of interest

Time Non-UC Existing UC New UC
2018-19 33561 757 N/A
May-20 14262 282 267
Jul-20 12635 284 253
Nov-20 11328 237 257
Mar-21 11806 252 351

Source: University of Essex, Institute for Social and Economic Research. Understanding Society: COVID-19 Study, (2021) and University of Essex, Institute for Social and Economic Research, NatCen Social Research, Kantar Public. Understanding Society: Wave 10, 2018-2020, (2020).

The difference between existing and new UC claimants is of interest because there is previous research that indicates that new UC claimants, who were forced to claim UC due to the COVID-19 pandemic, are a demographically distinct group. In particular, new UC claimants were more likely to be earning higher wages and more likely to have savings.[v]  

It should be noted that it is possible that a small number of new UC claimants moved off UC at a later point, with some of the improvement in position of new UC claimants being affected by this.

Actual financial situation

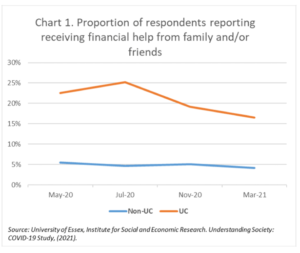
We begin by finding that a significant minority of both existing and new UC households were reporting not being up to date with household bill payments throughout the pandemic, as shown in Chart 1 below. 

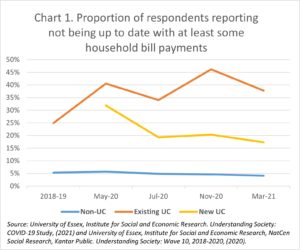
While the number of non-UC respondents who report not being up to date has remained steady between 2018-19 and May 2020 (5% and 6% respectively), we do find a notable increase in this financial problem among existing UC claimants, rising from 25% in 2018-19 to 41% in May 2020. This changed to 34% in July 2020, rose to a high of 46% in November 2020, and then fell to 38% in March 2021, highlighting the large extent to which existing UC claimants continue to face issues with household bills.

On the other hand, while a relatively high proportion of new UC claimants report not being up to date with at least some household bills near the start of the pandemic in May 2020 (32%), this declined to 19% in July 2020, remained at 20% in November 2020 and then went to 17% in March 2021, indicating that new UC claimants were less likely to face this specific financial challenge as the pandemic continued.  

The difference between existing UC claimants and non-UC respondents reporting not being up to date with at least some household bill payment rose by 14 percentage points between before the pandemic (2018-19) and March 2021. Similarly, the difference between existing and new UC claimants rose by 11 percentage points between near the start (May 20) and the later stages of the pandemic (March 2021).

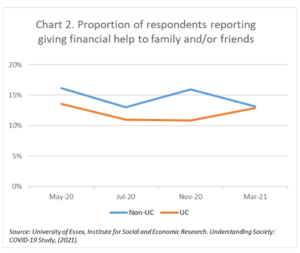
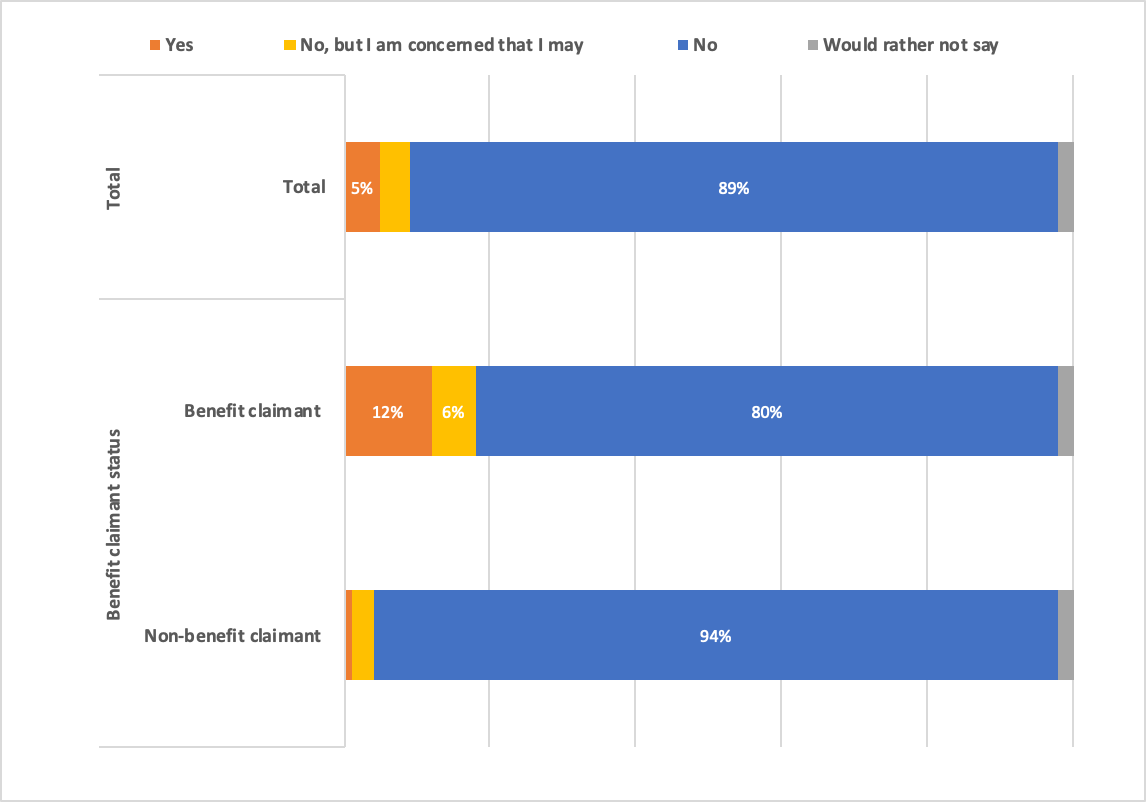
We then focused on an even more specific financial challenge: the proportion of respondents who report not being up to date with housing payments (for example, rent or mortgage) currently[vi], as seen in Chart 2 below.

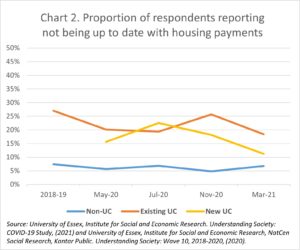
We once again, unsurprisingly, find a large gap between the experience of UC claimants and non-UC respondents. While only 7% of non-UC respondents in 2018-19 report falling behind on housing payments, this rises to 27% among existing UC claimants. The gap narrows slightly during the early stages of the pandemic, as 6% of non-UC respondents and 20% of existing UC claimants report not being up to date with housing payments in May 2020.

Despite the Government increasing the housing element of UC to ensure it matches at least the 30th lowest percentile of rents in the local area at the start of the pandemic[vii], a notable minority of existing and new UC claimants report not being up to date on housing payments during the pandemic. For existing UC claimants, between 18% and 26% report facing this financial challenge between May 2020 and March 2021, with slight variation and a peak in November 2020 during the first year of the pandemic. On the other hand, 16% of new UC claimants in May 2020 and 23% in July 2020 report not being up to date with housing payments, but there is a notable decline to 18% in November 2020 and 11% in March 2021.

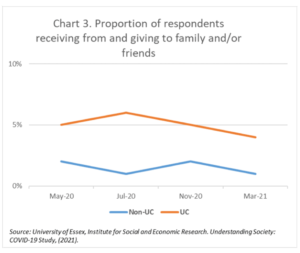
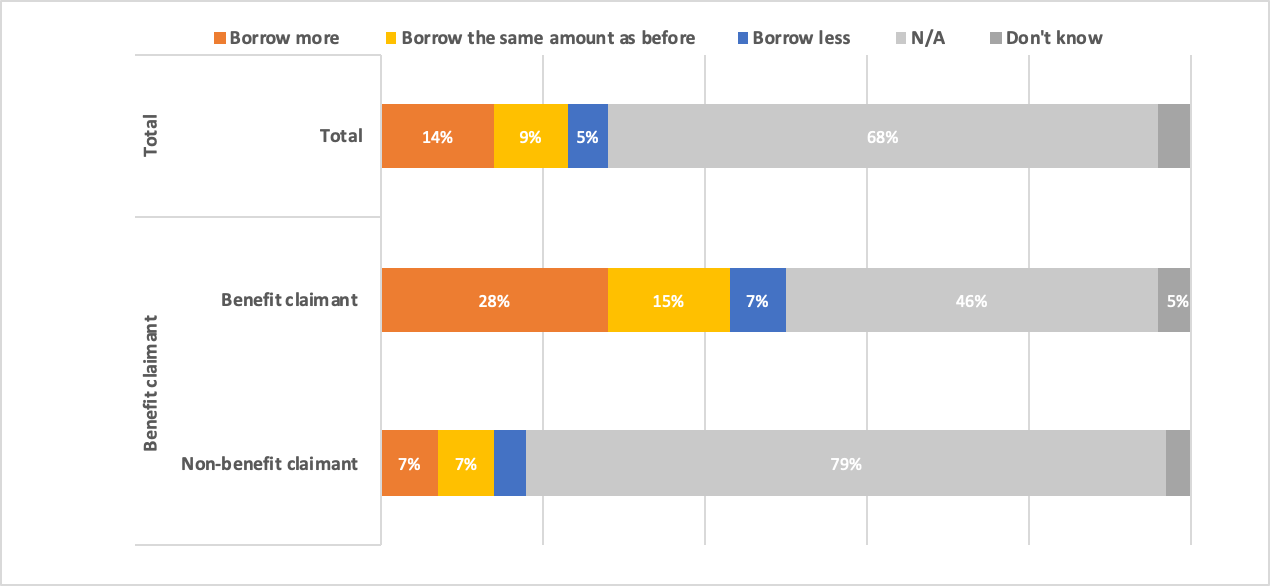
We then examined the proportion of respondents who, during the pandemic, reported changes in their personal debt over the last four weeks, as shown by Chart 3 below.

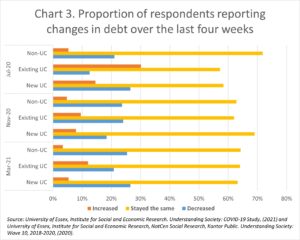
First, we find that among all population groups and during all time periods, the majority of people’s debt levels has stayed the same. However, what is notable is that both non-UC respondents and new UC claimants were more likely to be decreasing the size of their debt than increasing it at different points of the pandemic. Meanwhile, existing UC claimants were more likely to face a worsening than an improving financial situation in the initial part of the pandemic, with 30% reporting increasing the size of their debts compared to 13% decreasing it in July 2020. However, the number of existing UC claimants who were still increasing their debt fell to 12% by March 2021, but a much higher proportions of 21% of existing UC claimants reported decreasing their debt by March 2021.

Perceived financial situation

We then examine people’s subjective perceptions of how they are managing financially currently, finding that there have been some notable changes in this perception as the pandemic progressed, as Chart 4 shows below. This chart shows the proportion of respondents finding it difficult (‘quite’ and ‘very’ difficult) to manage financially.

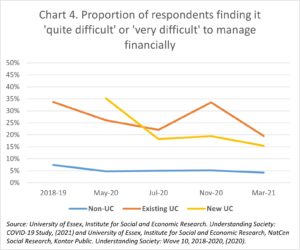
Unsurprisingly, we find a major gap between the number of non-UC respondents and UC claimants both in 2018-19 (7% vs 34% respectively) and near the start of the pandemic in May 2020 (5% vs 26% respectively) who report this, highlighting that a significant minority of UC recipients have continued to struggle financially.

However, we find that there was a slight decrease in number of existing UC claimants who report finding it difficult to manage financially within the initial months of the pandemic, with this seeing a decline from 34% in 2018-19 to 26% in May 2020 and 22% in July 2020, before rising back to 34% in November 2020, and then falling back considerably to 19% in March 2021. 

On the other hand, the number of new UC claimants who find it difficult to manage financially starts relatively high (35%) in May 2020, indeed higher than existing UC claimants, but notably declines in the following months, falling to 18% in July 2020, 19% in November 2020 and then 15% in March 2021.

 Interestingly, the difference between existing UC claimants and non-UC respondents finding it difficult to manage financially declined by 11 percentage points between before the pandemic (2018-19) and March 2021. Similarly, the difference between new UC claimants and non-UC respondents declined by 19 percentage points between near the start (May 20) and the later stages of the pandemic (March 2021).

Turning to future perceptions of finances, we find a notable improvement over the course of the pandemic in all people’s perceptions, as shown in Chart 5 below. This is somewhat unsurprising, since other findings in this analysis point to, with some fluctuation, the financial situation of both existing and new UC claimants improving throughout the pandemic.

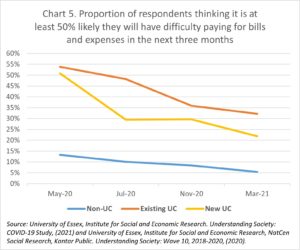
We find that negative perceptions of future finances are much more common among both existing and new UC claimants than non-UC respondents throughout the pandemic, especially close to the start of the pandemic in May 2020, when only 13% of non-UC respondents expressed this, as opposed to majorities of 54% of existing and 51% of new UC claimants, highlighting the much higher degree of financial uncertainty UC claimants have faced. 

While both existing and new UC claimants are much more likely to think there is a major chance they will have difficulty paying for bills and expenses in the next three months, this perception does decline from the early months of the pandemic, falling from 54% to 32% among existing UC claimants between May 2020 and March 2021 and from 51% to 22% among new UC claimants in the same time period. The decline in anxiety around future finances appears to have happened more quickly among those who are new UC claimants. 

Notably, the difference between the number of existing UC claimants and non-UC respondents finding it at least 50% likely they will have difficulty paying for bills and expenses in the next three months declined by 14 percentage points between May 2020 and March 2021. Similarly, the difference between new UC claimants and non-UC respondents declined by 21 percentage points May 20 and March 2021.

Finally, we have also examined broad life satisfaction of UC claimants during the pandemic, as shown in Chart 6 below.

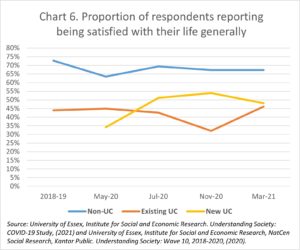
Several interesting trends emerge when we look specifically at the respondents who report feeling satisfied. First, it should be noted that even before the pandemic, there was a significant gap in life satisfaction between non-UC respondents (73%) and existing UC claimants (44%), as would be expected.

Second, while life satisfaction did fall in May 2020 for people who are not UC claimants relative to the responses given in 2018-19 (73% to 64%), the same fall did not occur for existing UC claimants (44% to 45%) at the start of the pandemic. 

Third, while new UC claimants were slightly less likely to report being satisfied than existing UC claimants in May 2020 (34% vs 45%), this trend reversed as the pandemic continued and by November 2020, a majority (54%) of new UC claimants report being satisfied, as opposed to 32% of existing UC claimants. However, the two groups moved closer, so that by the later stage of the pandemic in March 2021, 46% of existing and 48% of new UC claimants reporting being satisfied with their life.

Conclusion

First, it is vital to highlight that our analysis shows that significant minorities of both existing and new UC claimants faced major difficulties in their financial situation throughout the first year of the pandemic, and were much more likely to face these issues than the rest of the public, despite the increase in government support provided through working age benefits.

Second, the situation for existing UC claimants has shifted throughout the pandemic, with some evidence for improvement relative to non-UC respondents as the pandemic progressed, especially by March 2021. The picture is more mixed relative to 2018-19, with existing UC claimants seeing a variety of differences in their actual and perceived financial difficulties. 

Third, it is notable that while new UC claimants were facing actual and perceived financial difficulties at a similar rate to existing UC claimants closer to the start of the pandemic in May 2020, they were more likely to experience a notable improvement in their financial situation as the pandemic continued, and by November 2020, new UC claimants were less likely to express having several types of financial difficulties than existing UC claimants. However, the gap appears to narrow in actual and received financial situation by the later stages of the pandemic in March 2021.

References

[i] Matthew Whittaker, “Paying for the pandemic: the economic consequences of COVID-19”, The Health Foundation, https://www.health.org.uk/news-and-comment/blogs/paying-for-the-pandemic-the-economic-consequences-of-covid-19, 2021.

[ii] Institute for Fiscal Studies, “Spending and saving during the COVID-19 crisis: evidence from bank account data”, https://www.ifs.org.uk/publications/15146, 2020.


[iii] University of Essex, Institute for Social and Economic Research. Understanding Society: COVID-19 Study, (2021). [data collection]. 4th Edition. UK Data Service. SN: 8644, 10.5255/UKDA‐SN‐8644‐4.


[iv] University of Essex, Institute for Social and Economic Research, NatCen Social Research, Kantar Public. Understanding Society: Wave 10, 2018-2020, (2020). [data collection]. 13th Edition. UK Data Service. SN: 6614, http://doi.org/10.5255/UKDA-SN-6614-14.


[v] Peabody, “Credit where it’s due? Claiming Universal Credit during the COVID-19 pandemic”, https://www.peabody.org.uk/media/14903/universal_credit_34.pdf , (2021).


[vi] *2018-19 respondents were asked a slightly different question: whether they were not up to date on housing payments in the last 12 months.


[vii] HM Treasury,“The Chancellor Rishi Sunak provides an updated statement on coronavirus”, https://www.gov.uk/government/speeches/the-chancellor-rishi-sunak-provides-an-updated-statement-on-coronavirus# (2020).


[Image: Tierra Mallorca]

Helen Barnard: Levelling up requires a strong social security system

By Centre Write, Welfare

Is levelling up a Christmas tree or a bullet train? Will we look back at it as a flabby concept onto which politicians, wonks, and campaigners competed to hang their favourite policy bauble or as a driving force, taking the country towards transformed prospects in those places which will be hardest fought at the next election? 

Levelling up was set to be the defining concept of the new Johnson Government, but has been drowned out by the demands of dealing with Covid-19. As the health crisis recedes, the speed and shape of our economic recovery will become the defining issue facing government. We must revive levelling up and take bold action to redesign our economy. 

Levelling up marries two pressing economic and social issues. The first is the poor productivity that has dogged our economy, creating a historically weak recovery since the 2008 recession. The second is the rising tide of poverty, driven by increases among workers and children. There are unproductive firms and people trapped in hardship in every part of the UK, but these problems do have a specific geography. 

Levelling up must mean transforming both productivity and prospects in those parts of the UK with weak local economies. Low-income voters gave Boris Johnson’s Conservatives a decisive victory in 2019. That was, in part, because he convinced them that economically ‘left behind’ places would see a greater share of national resources, more and better jobs, opportunities for their children, and renewed local infrastructure. 

Social security has not been prominent in debates about levelling up, but woe betide a government that forgets its crucial role for those people and places who will pass judgement on whether the levelling up promise has been delivered. New research into the most extreme poverty in the UK, destitution, found the proportion of people experiencing it rose by 54% between 2017 and 2019 – to 2.4 million people, including over half a million children. 

Strikingly, the greatest rises were in the North of England. The North East now has the highest rates of destitution, with areas like Middlesbrough and Newcastle badly affected. In the North West, Manchester, Liverpool, and Blackpool all have high rates of destitution. The Government’s levelling up agenda cannot succeed without action to stem the rising tide of extreme hardship in the North, and social security has a crucial part to play in that. 

Social security is an underpinning public service, like our NHS, which many of us rely on over the course of our lives. Partly it compensates for market failures: the lack of truly affordable homes, low paid and insecure jobs, job design that shuts disabled workers, parents and carers out of better paid work. 

Successful levelling up should reduce the pressure on the social security system as these failures are corrected, but social security is also a mutual support system for times in our lives when work, or full-time work, isn’t feasible. It is an anchor that keeps us steady through tough times, until we find our feet again: when families break down, illness strikes or the work dries up. It is a base that enables people to take risks. 

Boosting pay often requires us to change jobs or set up a new business. Taking that leap is risky. A new bus route might prove unreliable, leading to job loss; a new childcare arrangement to allow longer work hours might break down; the long road to make a new business profitable might turn into a dead end. To truly level up means turning weak local economies into thriving engines of prosperity. A strong social security system is a crucial ingredient in creating that vibrant economy. 

We must therefore redesign social security as we redesign our economy. It must provide reliable protection from destitution, which means working with those who are experienced in the current system to fix design flaws, such as the five week wait for the first Universal Credit payment, and unaffordable debt deductions. 

Wider action to boost job security and pay should accompany reforms to ensure social security support smooths fluctuations in earnings rather than exacerbating them. Work incentives should focus on those groups most sensitive to them, particularly single parents and second earners. Services to help people to get and keep good quality jobs need to be integrated at the level of local labour markets. Skills, employment support, childcare, and transport all combine to either open up opportunities or close them down. 

Levelling up requires a coherent local strategy across all these areas, underpinned by an effective, compassionate social security system, rooted in the expertise of those who rely on it.

Helen Barnard is the Director of the Joseph Rowntree Foundation. This article first appeared in our Centre Write magazine The Great Levelling?. Views expressed in this article are those of the author, not necessarily those of Bright Blue. [Image: Alex Proimos]

Anvar Sarygulov: Shaky foundations: the scale and cost of state support for housing costs

By Anvar Sarygulov, Centre Write, Welfare

Introduction

State spending on support for housing costs, which primarily relates to spending on Housing Benefit (HB) and the Housing Element of Universal Credit (UC), is set to increase substantially as we continue to recover from the economic impact of COVID-19.

Total government expenditure on support for housing costs is forecast to increase by 52% between 2000 and 2025 in real terms,[i] reaching £24.8 billion a year in 2025, mirroring the rise in spending in the early 2010s that came as a result of the global financial crisis and rising rental prices. While the relatively good economic situation of late 2010s and aggressive action to curb this expenditure, which was taken by consecutive Conservative-led Governments out of concern for deficit levels, did lead to some decrease in state spending on support for housing costs by 2020, this is set to be undone by the pandemic.

The most notable action taken to control state spending for support on housing costs in the 2010s was changing the levels of Local Housing Allowance (LHA). LHA, originally introduced in 2008, is used to calculate the entitlement of private renters receiving support for housing costs by looking at broad rental prices in a local area, to then set the maximum benchmark for how much claimants living in that area can receive. Originally set to match the 50th percentile of rental levels in a local area, this was decreased to the 30th percentile in 2011,[ii] and LHA levels were completely frozen between 2016 and 2020. As a result, the actual value of LHA has dropped below the 30th percentile in almost all areas, as private rental prices in the UK rose by 8.6% between 2015 and 2020.[iii]

Hence, in 2019, 97% of claimants who are private renters received state support that could not meet the cost of a home rented at the 30th percentile,[iv] leading to many households having to use money from elsewhere, including other benefits, to cover the shortfall. Understandably, this has put an even greater strain on the finances of low-income households, with evidence that the cuts to housing support were pulling them into relative poverty, as defined as below 60% of average household income.[v]

As part of the response to COVID-19 and the financial hardships it is placing on families, the UK Government in March 2020 increased LHA to once again match the 30th percentile of rents.[vi] However, it is intending to once again freeze LHA rates for 2021-2022.[vii]

This analysis explores how the increase in claims for state support for housing during this COVID-19 pandemic differs by each English local authority. Coupled with our last analysis piece,[viii] which explored how the increase in overall UC claims during the pandemic is distributed across different parts of the country, this allows us to paint a picture of the consequences of the pandemic on geographic inequality, specifically the Government’s ‘Levelling Up’ agenda, which is trying to better support so-called ‘left-behind’ areas in coastal towns and industrial communities.


State support for housing costs during COVID-19

To examine the scale of expansion of state support for housing costs during the pandemic, Bright Blue has combined two different sources of the latest data on state support for housing costs between February and November 2020: data from claims for HB, and data from households on UC which have a ‘housing costs element’ as part of their claim, both of which originate from official DWP data releases.[ix]

We need to rely on both datasets to assess the increase in state support for housing costs during the pandemic for several reasons. For working-age households, new claims for state support for housing costs can only be obtained by receiving the ‘housing costs element’ of UC as the introduction of UC was completed for new working-age claimants across the UK in 2018. But pensioners are still able to make a new claim for HB.

Furthermore, the non-pensioner cohort which is still claiming HB are those who have been relying on it for a long time and have not moved to UC: specifically, long-term recipients of Working Tax Credit whose circumstances have not changed for several years, the long-term unemployed and those who have a disability or a long-term health condition. There is a constant outflow of non-pensioner legacy HB claimants who are switching to UC due to a change in circumstances.

First, we quantify the change in the proportion of all households (both working-age and pension-age) in each English local authority claiming state support for housing costs in the first nine months of the pandemic, between February and November 2020.

A higher proportion of households in urban local authorities in England, especially in London, claim housing support from the state. For example, as of February 2020, just before the pandemic hit the UK, an average rural local authority had 12.2% of all households receiving state support for housing costs, as opposed to 18.8% in an average urban local authority. Similarly, while an average non-London local authority had 15.4% of all households claiming state support for housing costs, in London the average was 22.6%. This is unsurprising considering home ownership patterns , with those living in urban areas being more likely to rent.[x]

As Chart 1 below shows, this urban-rural divide in levels of all households claiming state support for housing costs has been widened further by the pandemic. The increase in the proportion of all households claiming state support for housing costs has been much more pronounced in urban areas, especially London, than rural areas. In fact, there has been, on average, a 3.7 percentage point rise in the proportion of all households claiming state support for housing costs in the average urban English local authority in the first nine months of the pandemic, as opposed to a 2.3 percentage point rise in the average rural English local authority.

London, in particular, stands out as experiencing a significant increase in the proportion of all households claiming state support for housing costs during the first nine months of the pandemic. While on average, the proportion of all households receiving state support for housing costs has increased by 2.8 percentage points across all English local authorities outside of London in the first nine months of the pandemic, this rises to an average of 5.9 percentage points in London.

We can also rank the English local authorities with the highest and lowest increases in the proportion of all households claiming state support for housing costs during the first nine months of the pandemic. Table 1 below shows the 20 local authorities in England with the highest and lowest increases in the proportion of all households claiming state support for housing costs during the pandemic, alongside the total proportion of all households in that local authority now claiming such support, as of November 2020. The final column shows the proportion of new claimants of state housing support during the first nine months of the pandemic that were renting from private rather than social landlords, which is discussed in further detail below.

Table 1: English local authorities with the highest and lowest increase in % of households claiming state support for housing costs between February 2020 and November 2020 

Source: Department for Work and Pensions, Stat-Xplore (2021); Office for National Statistics, Rural/urban classifications (2020).

As shown in Table 1 above, London local authorities dominate the top 20 English local authorities with the biggest increase in all households claiming state support for housing costs in the first nine months of the pandemic. Specifically, 17 of the 20 local authorities with the highest increases in all households claiming state support for housing costs were in London.

The London borough of Newham has seen the biggest increase in all households claiming housing support since February 2020, of 11.2 percentage points, meaning that in November 2020, over two in five of all households were claiming state support for housing costs. Overall, the increases in all households claiming state support for housing costs has led to a situation where in four English local authorities, all located in London (Newham, Haringey, Brent, and Hackney), a startling 40% of households or more are in receipt of state support for housing costs.

In contrast, the local authorities with the smallest increases in the number of households claiming state support for housing costs are relatively more geographically spread out and are located across various regions of England. For example, Copeland has seen only a 1.2 percentage point increase. Unsurprisingly, compared to London, these local authorities were seeing lower levels of households claiming state support for housing costs even before the pandemic, but it is important to note that the gap has now increased even further as a result of the effects of COVID-19.


State support for private renters

We now focus on the tenure of the households that have newly claimed for state support for housing costs. We can do this by analysing whether the new claimants for the housing element of UC are in private or social households, using the DWP data releases.[xi] As we are examining the new inflows of claimants, rather than the total number, we are only examining data from UC and not from HB. As aforementioned, those in the private rented sector have support capped at 30% of local rents after changes in March 2020.

The growth in claims for state support for housing costs is driven mostly by those renting privately. In February 2020, 53.3% of households on UC which received the housing element were renting socially, while 45.5% were renting privately. By November 2020, the proportion reversed, with 45.1% of households renting socially, while 53.5% were renting privately, while the number of households on UC receiving the housing element increased by more than 1.1 million, from 1.6 million to 2.8 million. The fact that most new UC claimants who are receiving the housing element of UC are renting privately is not surprising, considering that social renters are more likely to be older and out of employment.[xii] As such, they were less likely to be affected by the economic fallout from the pandemic, as the effects of COVID-19 have been more likely to affect younger employees.[xiii]

Chart 2 below displays the proportion of increase in UC claims with a housing element by each English local authority between February and November 2020 where the household is renting privately.

In 212 out of 317 English local authorities (66.8%), the proportion of new claimants of state support for housing costs in the first nine months of the pandemic who are privately renting is above 60%.

Many of the English local authorities where the increase has been driven overwhelmingly by private renters are the same local authorities that experienced higher increases in households receiving state support for housing costs, as shown in the final column of Chart 1 further above. This is especially the case in London.

For example, as illustrated in Table 1, Newham has seen the largest increase in households claiming state support for housing costs in the first ten months of the pandemic, at 11.2 percentage points. Concurrently, Newham is also the local authority with one of the higher proportions of private renters making up the increase in claims for state support for housing costs, at 80.1%.


Conclusion

As a result of COVID-19, the number of households claiming state support for housing costs is rising across England, particularly in London and other urban areas. Some English local authorities now have more than 40% of all households claiming such support. It is primarily those living in the private rented sector that are driving this rise in state support for housing costs claims, especially in London.

The numbers claiming state support for housing costs will naturally recede as the economy recovers from the pandemic, but forecasts suggest that spending on state support for housing costs will remain high until at least 2025.[xiv] The overall numbers claiming state support for housing costs and the total amount being spent by the government should make policymakers think deeply about the sustainability of rising state subsidies for housing costs, especially for those residing in the private rented sector. At the same time, continuing to erode the level of state support for housing costs relative to rental market prices for several years will continue to place low-income households into worse financial positions.

Anvar Sarygulov is a Senior Research Fellow at Bright Blue.

[i] Department for Work and Pensions, “Benefit expenditure and caseload tables 2020”, https://www.gov.uk/government/publications/benefit-expenditure-and-caseload-tables-2020 (2020).

[ii] House of Commons, “Local housing allowance and homelessness”, https://commonslibrary.parliament.uk/research-briefings/cdp-2019-0199/ (2019).

[iii] Office for National Statistics, “Index of Private Housing Rental Prices, UK: January 2021”, https://www.ons.gov.uk/economy/inflationandpriceindices/bulletins/indexofprivatehousingrentalprices/january2021 (2021).

[iv] Shelter, “Local Housing Allowance and Homelessness”, https://assets.ctfassets.net/6sxvmndnpn0s/4Ehd4bgEjOrTnm2HDGqcbC/0f3efd8340050906129e6f9e7acee0de/LHA_and_homelessness.pdf (2019).

[v] Joseph Rowntree Foundation, “UK Poverty 2019/20: Housing”, https://www.jrf.org.uk/report/uk-poverty-2019-20-housing (2020).

[vi] HM Treasury, “The Chancellor Rishi Sunak provides an updated statement on coronavirus”, https://www.gov.uk/government/speeches/the-chancellor-rishi-sunak-provides-an-updated-statement-on-coronavirus# (2020).

[vii] Department for Work and Pensions, “Social Security Benefit and Pension Up-rating 2021/22”, https://questions-statements.parliament.uk/written-statements/detail/2020-11-25/hcws600 (2020).

[viii] Anvar Sarygulov, “Widening chasms”, Bright Blue, https://www.brightblue.org.uk/widening-chasms-analysis/ (2021).

[ix] Department for Work and Pensions, “Stat-Xplore”, https://stat-xplore.dwp.gov.uk/webapi/jsf/login.xhtml (2021).

[x] Office for National Statistics, “UK private rented sector: 2018”, https://www.ons.gov.uk/economy/inflationandpriceindices/articles/ukprivaterentedsector/2018 (2019).

[xi] Department for Work and Pensions, “Stat-Xplore”, https://stat-xplore.dwp.gov.uk/webapi/jsf/login.xhtml (2021).

[xii] Ministry of Housing, Communities & Local Government, “English Housing Survey: Social rented sector, 2017-18”, https://assets.publishing.service.gov.uk/government/uploads/system/uploads/attachment_data/file/856046/EHS_2017-18_SRS_report_revised.pdf (2018).

[xiii] Institute for Fiscal Studies, “COVID-19 and the career prospects of young people”, https://www.ifs.org.uk/publications/14914 (2020).

[xiv] Department for Work and Pensions, “Benefit expenditure and caseload tables 2020”, https://www.gov.uk/government/publications/benefit-expenditure-and-caseload-tables-2020 (2020).

Anvar Sarygulov: Widening chasms

By Anvar Sarygulov, Centre Write, Welfare

It is no secret that the economic fallout from the COVID-19 pandemic is worsening existing inequalities. The pandemic has had an asymmetric impact on jobs, putting the greatest strain on areas where sectors such as hospitality and tourism are significant, and which are more likely to employ low-income workers.

By examining differences in Universal Credit (UC) uptake across England, we can observe the severity of the pandemic’s economic impact on each local authority in England. We can explore the consequences of the pandemic on geographic inequality, specifically the Government’s ‘levelling up’ agenda which is trying to better support so-called ‘left-behind’ areas in coastal towns and industrial communities.

This analysis is unique in two ways. First, it is analysis which uses the latest available data on UC claimants, which is from October 2020. Second, this analysis goes beyond examining only increases in unemployment by English local authorities, by looking at overall increases in UC claimants, meaning we will capture both those who have become unemployed but also those still in work who have lost hours or income and now need to claim UC. It is important to consider the latter group, as while 56% of the increase in UC claimants between March and October 2020 is composed of unemployed claimants, 44% of this increase is composed of employed UC claimants.

We first focus on the Index of Multiple Deprivation (IMD) calculated in 2019, which aggregates deprivation factors related to income, employment, education, health, crime, barriers to housing and living environment. IMD ranks all local authorities, with a higher rank representing a higher degree of deprivation relative to other areas.[i] Hence, rank 1 represents the most deprived local authority and rank 317 the least deprived. We then compare it against the increases in the working-age population (those aged between 16 and 64) who are claiming UC between February and October 2020.[ii] [iii] As mentioned above, this increase in UC claimants not only includes individuals who have become unemployed during the pandemic, but also those in work who have started claiming UC due to a fall in their income.

The relationship between a local authority’s IMD ranking and increase in UC claimants during the first eight months of the pandemic is shown in Chart 1 below.

Chart 1 above illustrates the clear asymmetric nature of the pandemic’s impact, with local authorities that already faced higher deprivation also being more likely to see larger increases in proportion of people claiming UC. In fact, the 10% most deprived local authorities have seen on average an 8.5%-point increase in working age population claiming UC, as opposed to an average 4.8%-point increase for the 10% least deprived local authorities. Hence, the difference in increased uptake of UC is to some extent widening existing geographic inequalities. The pandemic is undermining the current Government’s attempt to ‘level up’ so-called ‘left-behind’ areas of the UK.

London local authorities, highlighted in orange, stand out as particularly unique. Generally, London local authorities have a much higher increase than non-London English local authorities in the number of UC claimants during the first eight months of the pandemic. This is unsurprising, considering many Londoners work in industries that have been affected the most by the pandemic.  On average, London boroughs have seen an 8.3%-point increase in the working age population claiming UC as opposed to 6.3%-point increase in all other English local authorities.

But note among London local authorities the consistency with the trend among all other English local authorities: namely, more deprived London local authorities are more likely to have had a significant increase in UC claimants than the least deprived. In fact, for London local authorities, the disparities are even starker: the 10% most deprived London local authorities have seen an average 12.2%-point increase in UC claimants since February, in contrast to an average 4.6%-point increase in the 10% least London deprived local authorities.

We can also rank the English local authorities with the highest and lowest increases in UC during the first eight months of the pandemic. Table 1 below shows the 20 local authorities in England with the highest and lowest increases in UC during the pandemic, alongside their IMD ranking.

Table 1. 20 English local authorities with the highest (left) and lowest (right) increase in proportion of working age population claiming UC between February and October 2020

Source: Department for Work & Pensions, Stat-Xplore: People on UC (2020); Office for National Statistics, Estimates of the population for the UK, England and Wales, Scotland and Northern Ireland (2020); Ministry of Housing, Communities & Local Government, English indices of deprivation 2019 (2019)

As shown in red in Table 1, London local authorities dominate the top 20 local authorities with the biggest increase in UC claimants in the first eight months of the pandemic. Specifically, 12 of the 20 local authorities with the highest increases in UC claimants were in London.

The London borough of Haringey has seen the biggest increase in UC claimants since February, of 12.4%-points, meaning that in October, 19.7% of its working age population were claiming UC.

Table 1 also shows that, other than the unique borough of the City of London, the local authorities that have experienced the lowest increase in UC claimants are outside London and have very low deprivation. Alongside the City of London, Rushcliffe, an affluent district in Nottinghamshire, has seen the smallest increase – of 3.8%-points. This means only 6.2% and 6.7% of the working age population in the City of London and Rushcliffe respectively are currently claiming UC.

Many of the places that have seen the greatest increases in UC claimants outside of London are English local authorities which have already struggled significantly economically and socially. Some of the local authorities with the highest increases, such as Blackpool (the most deprived local authority in England, according to the IMD), Hull and Middlesbrough, are coastal towns and post-industrial communities, prime targets for the ‘levelling up’ agenda of the current Government.

As unemployment continues to rise, and job hours and opportunities reduced, it will be essential for government to help people find new jobs or more hours quickly so they do not suffer the scarring impacts of long-term unemployment or underemployment, providing appropriate education and training support for those who would benefit from it.

But some local authorities will be better able to bounce back and increase employment opportunities. This is because there is a strong correlation between those with higher educational attainment and a shorter period of time spent in unemployment.[iv]

We now focus on the Index of Education, Skills and Training Deprivation, calculated in 2019, which ranks local authorities on a combination of rates of school attainment, school absences, entry to higher education, number of adults with low qualifications and English language proficiency.[v]  A higher rank represents a higher degree of deprivation relative to other local authorities, meaning rank 1 represents the most educationally deprived local authority and rank 317 the least deprived. We then compare it against the increases in the working-age population (those aged between 16 and 64) who are claiming UC between February and October 2020.

Doing this analysis will indicate whether the geographical inequalities caused by the pandemic are likely to be sustained for a longer time. In other words, if local authorities have high rates of UC claimants but high education levels, they may be able to bounce quicker in terms of employment outcomes, whereas local authorities with high rates of UC claimants but low education levels, may struggle and be left-behind even more for a longer period of time.

The relationship between a local authority’s Index of Education, Skills and Training Deprivation ranking and increase in UC claimants during the first eight months of the pandemic is shown in Chart 2 below.

Chart 2 illustrates a clear relationship between local authorities experiencing higher rates of UC claimants and having lower levels of education, according to the Index of Education, Skills and Training Deprivation. The gap is notable, with the 10% most educationally deprived local authorities seeing an average 7.7%-point increase in working age population claiming UC, as opposed to a 5.3%-point increase in the 10% least educationally deprived.  This indicates that those English local authorities experiencing higher rates of UC claimants are also those less likely to be able to bounce back quickly with increased employment outcomes. This implies the pandemic could be undermining government attempts to ‘level-up’ so-called left-behind areas of the country over the long-term.

As Chart 2 shows, London is unique again, in that its local authorities have high increases in UC claimants but relatively high education levels. This means it is better placed to revitalise levels of employment outcomes quickly, since its population has relatively higher levels of education and skills. In the long-term, then, despite the generally higher increases in UC claimants in London now, it could be that more deprived areas of England outside London – especially in industrial and coastal communities – experience more long-term reduced employment opportunities.

But note among London local authorities the consistency with the trend among all other English local authorities: namely, more educationally deprived local London authorities are more likely to have had a significant increase in UC claimants than the educationally least deprived, with the 10% most educationally deprived areas in London seeing an average 10.5%-point increase in UC claimants as opposed to an average 4.6%-point increase for the 10% least educationally deprived.

Table 2 lists the top 20 most educationally deprived local authorities in England alongside the increase in UC claimants for the first eight months of the pandemic.

Table 2. 20 English local authorities with the lowest rank of Education, Skills and Training deprivation and the increase in proportion of working age population claiming UC between February and October 2020

Source: Department for Work & Pensions, Stat-Xplore: People on UC (2020); Office for National Statistics, Estimates of the population for the UK, England and Wales, Scotland and Northern Ireland (2020); Ministry of Housing, Communities & Local Government, English indices of deprivation 2019 (2019)*Local authorities in London are marked in red

Table 2 shows that the most educationally deprived local authorities in England are in so-called left-behind areas, industrial and coastal communities such as Boston, Hull, Stoke-on-Trent, Blackpool, and Bolsover. In fact, eight of these 20 English local authorities are in at least one constituency which belonged to the so-called Red Wall seats that the Tories won in the 2017 or the 2019 General Election, making them a key part of the Conservative Party’s future electoral success.

These so-called left-behind areas already required significant support and investment before the pandemic. The pandemic risks causing them to fall further behind, especially in regards to employment opportunities. The pandemic really has made ‘levelling up’ a lot harder. The Government should ensure that these areas get sufficient resources when the pandemic ends, and the economic recovery begins, to avoid this.

Anvar Sarygulov is a Senior Research Fellow at Bright Blue.

Endnotes

[i] Ministry of Housing, Communities & Local Government, “English indices of deprivation 2019”, https://www.gov.uk/government/statistics/english-indices-of-deprivation-2019 (2019).

[ii] Office for National Statistics, “Estimates of the population for the UK, England and Wales, Scotland and Northern Ireland”, https://www.ons.gov.uk/peoplepopulationandcommunity/populationandmigration/populationestimates/datasets/populationestimatesforukenglandandwalesscotlandandnorthernireland (2020).

[iii] Department for Work and Pensions, “People on Universal Credit”, Stat-Xplore, https://stat-xplore.dwp.gov.uk/webapi/jsf/login.xhtml (2020).

[iv] W.C. Riddell and X. Song, “The Impact of Education on Unemployment Incidence and Re-employment Success: Evidence from the U.S. Labour Market”, Institute for the Study of Labour, http://ftp.iza.org/dp5572.pdf (2011).

[v] Ministry of Housing, Communities & Local Government, “English indices of deprivation 2019”, https://www.gov.uk/government/statistics/english-indices-of-deprivation-2019 (2019).

Miatta Fahnbulleh: A radical overhaul of the welfare system is needed for the fallout from COVID

By Centre Write, Coronavirus, Welfare

The economic fallout from the pandemic is nothing short of grim: a projected 14% contraction in the economy this year; the deepest recession for 300 years and unemployment twice as high as before the crisis. 

Behind these headline numbers are millions of people who face a catastrophic hit to their livelihoods. We have yet to understand the full impact of this on ordinary people’s lives. The early warning signs are alarming: 2.9 million new applicants for Universal Credit between 1st March and 19th May of this year, an estimated three million people going without meals since the lockdown and an 81% increase in food bank usage in March compared to 2019. All of this points to the inescapable reality that many families across the country are facing real hardship.

This hardship is exposing the gaping holes in our social safety net. We entered this recession with one of the weakest social security safety nets – both among advanced economies and in our own post-war history. Total out-of-work payments received by UK employees are on average 34% of their previous in-work income – the third lowest among 35 OECD advanced economies. At the outset of the crisis, the main adult unemployment payment was worth less than 15% of average earnings, lower than at any time since the creation of the welfare state. While the £20 per week boost to Universal Credit and working tax credits since then was a small step in the right direction, it only reversed one fifth of the overall cuts to welfare seen since 2010. And at £94 a week, many people who never imagined they would ever be on welfare are struggling to cope with an income that is simply too inadequate to live on. However we look at it, our social security system has been denuded to a worrying degree.

For too long, we have swept the inadequacies of our social security system underneath the carpet — the pandemic has laid it bare for all to see. We will have to respond – if not now, then when the swelling numbers relying on this system begin to make their voices heard. In responding, we must rekindle the spirit behind Beveridge’s welfare state: the ambition to deliver a minimum standard of living ’below which no one should be allowed to fall’. This was a key plank of the social contract that dominated for much of the post-war period. A contract that has slowly been broken.

At the heart of our response should be a new minimum income guarantee. In the heat of the current crisis, when the priority is to get much needed income support to families quickly, this should take the form of a temporary, upfront, non-conditional payment of £221 per week to anyone that needs it. This would provide much needed relief to an estimated 5.6 million people who are at risk of losing their jobs or hours and falling through the cracks of the Government’s job retention and income support schemes – as well as for the millions more who may yet be left stranded as these schemes start to become unwound from August. The case for doing this to ease the hardship of those at the sharp end of this crisis is clear, but it also has the benefit of boosting spending and demand in the economy, which in turn has the power to create the jobs needed for recovery.

As we recover from this crisis, we should then enshrine this principle of a minimum income guarantee into a social security system that badly needs reform. Through a combination of universal payments – that benefits all those who pay into the system – and means tested support for those that need it most, we must create an income floor that ensures that everyone can afford the basics for a decent standard of life.

We must move beyond the welfare state of old that was there to catch us when we fell on hard times to a wellbeing state that aims to provide everyone with the building blocks they need to live decent, fulfilling, healthy lives. Alongside a minimum income guarantee should be access to well-funded education, childcare, health and social care and quality housing to everyone that needs it. This should form the basis of a new social settlement coming out of the pandemic to replace the one that has frayed.  If we get this right, we have the chance to build back better from this crisis.

Miatta Fahnbulleh is the Chief Executive of the New Economics Foundation. This article first appeared in our Centre Write magazine Family friendly?. Views expressed in this article are those of the author, not necessarily those of Bright Blue. [Image: J J Ellison]

Peter Aldous MP: The Conservatives are taking rising need for food banks seriously – these new measures must be just the start

By Centre Write, Welfare

It has been a difficult year for families across the country. Despite the best efforts of the government, the pandemic has thrown many families newly into sudden financial hardship and tipped many of those already suffering into despair.

Nowhere has the hardship of this difficult year been clearer than in the levels of need for emergency food parcels – as new data from the Trussell Trust shows, more than 1.2 million emergency food parcels were given to people struggling to afford essentials by food banks in their network between April and September 2020. This represents the busiest ever half-year period for food banks in the Trussell Trust network, and may be just the tip of the iceberg, as many people will have been helped by other community groups during the crisis.

It is now impossible to dismiss needing a food bank as a relatively marginal experience, as may have happened in the past. The campaign led by Marcus Rashford has energised the whole debate and brought the issues of food banks and poverty into the political centre stage. As a Conservative MP, I welcome this desperately needed national conversation.

But words will only get us so far when people are suffering serious financial hardship every day. It was thus very welcome this last weekend to see the Government take clear action. In announcing a Covid Winter Grant Scheme, which provides a major and much needed £170 million funding boost for councils in England to provide local welfare, the government has taken a clear step towards the Prime Minister’s commitment to ensuring ‘no child goes hungry this Christmas’. What’s more this is just the start – the Department for Work and Pensions have said this is part of a long-term plan to tackle poor health, hunger and education in the UK.

But while this new package will undoubtedly help, we cannot rest on our laurels when financial hardship remains so high. I know first hand from my own constituency of Waveney that further action is needed. This local support must be complemented by a UK-wide social security system that is strong enough to ensure those most at risk of suffering during this crisis have enough money for essentials. This needs to include extending the £20 uplift to Universal Credit beyond next spring and extending to legacy benefits.

It also means taking action on the high levels of government debt being repaid by those on the lowest incomes. It cannot be right that almost three quarters of people arriving at food banks on Universal Credit are repaying advance payments. We need to see a long-term plan to tackle the five week wait and create a fairer approach for repaying debts – but in the meantime we need to see a temporary suspension to these benefit debt deductions which are pushing too many into hardship.

Behind these policies lies a moral mission. Which is that we as One Nation Conservatives will not accept a country with an ever rising need for food banks.

We can all do our bit to support this moral mission. An easy step I would urge others to take is to show their support for the Trussell Trust’s campaign for a Hunger Free Future – which is saying loud and clearly that no one should need to turn to a food bank, through volunteering, much needed donations or campaigning for change.

We must use this moment to protect those suffering most in the current crisis, and ensure that over the long-term we create a society in which no one is forced to turn to a food bank. Last weekend’s announcements are a major step forward – we must work together to build on this.

Peter Aldous is the Member of Parliament for Waveney. Views expressed in this article are those of the author, not necessarily those of Bright Blue.