Category

Anvar Sarygulov

Should government intervene to save failing businesses?

By Anvar Sarygulov, Frank Serpe, Home, Joseph Silke, Patrick Hall, Phoebe Arslanagic-Wakefield, Podcast, Ryan Shorthouse, Sam Robinson

This edition of our Heads Apart? podcast asks whether government should intervene to save failing businesses. We are joined by Giles Wilkes, Senior Fellow at the Institute for Government, and Madeline Grant, Assistant Comment Editor at The Telegraph.

Our Deep Dive feature sees Bright Blue researcher Sam Robinson interview Paul Johnson, Director of the Institute for Fiscal Studies, on what to expect ahead of Rishi Sunak’s first budget as Chancellor of the Exchequer.

Will this year’s budget see the abandonment of previously adhered to fiscal rules? Will the spread of the novel coronavirus, COVID-19, undermine the new Chancellor’s plans to begin ‘levelling up’ the country?

Members of the Bright Blue team also give their thoughts on the ongoing Democratic primary to decide who will be nominated to face Donald Trump at the end of the year.

Music credit: Lights by Sappheiros

Presented by: Ryan Shorthouse, Sam Robinson and Joseph Silke | Produced by: Joseph Silke, Phoebe Arslanagic-Wakefield and Sam Robinson

Anvar Sarygulov: Immediate public expectations of and priorities for the Conservative Government

By Anvar Sarygulov, BB Research, Centre Write, Politics

The Conservatives have secured a large majority in the 2019 General Election. A significant component to their success has been winning over voters which have not traditionally voted Conservatives, particularly amongst members of the working class in northern parts of England and Wales

While Brexit played a significant role in this, it is also important to acknowledge other policy shifts which have contributed. Boris Johnson’s Government has promised to break with the austerity that defined the 2010s, pledging more public spending, particularly for key public services such as the NHS and schools. Furthermore, with commitments to raise the minimum wage and infrastructure spending, Boris Johnson’s Government appears to be more economically interventionist than previous Conservative administrations. 

As the 2020s begin, it is worth reflecting on public expectations of and priorities for the new Conservative Government. Many promises have been made by the Conservatives during the election, especially for its new group of supporters on modest incomes. To what degree does the public expect these promises to be delivered? Are there policies which the public thinks would be of particular help to people on low and middle incomes, and to those living in areas described as ‘left behind’? And are there policy areas to which the public wants the Conservative Government to give greater priority to?

To answer these questions, we have conducted public polling, in partnership with Opinium, to examine public expectations of and priorities for the new Conservative Government.

Methodology

Polling was undertaken by Opinium and conducted between 20th and 30th December 2019, immediately after the General Election. It consisted of one nationally representative sample of 2,003 UK adults. From this overall sample we also have subsets of those who have voted Conservative (711), Labour (561) and Liberal Democrat (205) in the 2019 General Election. The sample was weighted by Opinium to reflect a nationally representative audience.

For nearly all questions, respondents could answer ‘Don’t know’. These responses are not shown in the below graphs for stylistic reasons. However, a link to the full data tables can be found at the bottom of this piece.

  1. Public expectations of the Conservative Government

In 2019, the Conservatives won record levels of support amongst those who are on low incomes. Despite this, the UK public is most likely to believe that the richest in society will do best under the new Conservative Government, with almost half (44%) indicating this, as Chart 1 indicates. In contrast, only 13% of the UK public believe that the working class will do best, and only 2% believe the poorest will do best.

However, as Chart 1 indicates, expectations of who will do best are heavily informed by political views. Conservative voters have notably different perceptions, believing first the middle class will do best (31%) and second the working class will do best (23%), while in contrast, more than three-quarters (76%) of Labour voters think the richest will do best.

As can be seen in Chart 2, the UK public is fairly pessimistic about the next five years. A majority of the UK public expects levels of undesirable trends – poverty (72%), crime (71%), inequality (71%) and national debt (72%) – to increase or stay the same. 

There is slightly less pessimism around the British economy: a slight majority expect the number of businesses (51%) and jobs (57%) to increase or stay the same, and a significant 70% expect wages to increase or stay the same over the next five years.

Furthermore, a minority (34%) of the UK public expect immigration to decrease under the new Conservative Government, despite this being a pledge in the recent Conservative Party manifesto.

There is a range of expectations in relation to high-profile policy promises that the Conservatives made during the 2019 general election campaign. As can be seen in Chart 3 below, a majority of the UK public expect the Conservatives to raise the National Insurance threshold to £12,500 (57%), to increase the national minimum wage to £10.50 (52%) and to reduce the number of low-skilled immigrants coming to Britain (54%). 

However, there is more scepticism on other high-profile commitments made by the Conservative Party. A majority of the UK public do not expect the Conservatives to deliver on ending rough sleeping (68%), a complete roll-out of fibre broadband (54%), and 50,000 more nurses (51%).

2. Public priorities for the Conservative Government

With the emphasis on Brexit during the 2019 general election campaign, it is unsurprising that a clear majority of both the British public (58%) and Conservative voters (62%) expect passing the Brexit legislation and leaving the EU to be the main priority for the new Conservative Government, as Chart 4 below shows. The NHS comes a distant second at 10% for all and 13% for Conservative voters. Labour and Liberal Democrat voters also have a similar view, with the majority (58% and 67% respectively) believing that Brexit will be priority.When discussing the main priority for increased public spending, the NHS comes significantly ahead of all other areas, as seen in Chart 5 below, with a firm majority of both the British public (57%) and Conservatives (58%) choosing it.

We tested public perceptions of whether the Conservative Government would and should prioritise key policy issues. As seen in Chart 6 below, the UK public is more likely to expect Boris Johnson’s Government to place low priority on almost all key policy issues, including climate change (47%), air pollution (48%), race and gender discrimination (57%), childcare (52%), pension reform (47%), Universal Credit (48%), integration of immigrants (46%) and human right violations abroad (61%). 

The only key policy area polled which the UK public are more likely to expect to be high priority than low priority is social care, with 41% stating this.

Hence, there is a significant gap between the level of priority that the UK public expects and wants to place on these key policy issues. The key policy issue the UK public wants to be a high priority is social care, with 73% wanting it to be a high priority issue. Coming joint second, 64% of people want climate change and air pollution to be a high priority issue. In addition, 58% of the public want pension reform to be a high priority issue, closely followed by childcare (55%) and Universal Credit (55%). 

3. Public priorities for supporting those on modest incomes

The British public is fairly divided on what the new Conservative Government should prioritise to support those on low and middle incomes. 

As seen in Chart 7 below, investing more in public services is the most popular choice among the UK public, with 27% believing this to be the best priority to support those on low and middle incomes. Next, 23% saw increasing the minimum wage as the priority for those on low and middle incomes, followed in third place by 16% of the UK public believe that cutting taxes is the best option. 

Notably, as Chart 7 illustrates, Conservative voters are almost equally split between these three top choices, but with increasing the minimum wage their preferred choice with 27% reporting this, followed by investing more in public services at 26%.


The variation of views on priorities across different income bands is also notable, as can be observed in Chart 7a below. Generally, those with lower incomes are more likely to report increasing the minimum wage than any other measure. For example, those earing below £10,000 and between £10,000 and £20,000 a year are more likely to say the increase in the minimum wage should be the priority compared to other priorities, including investing more in public services but especially cutting taxes.

Since the vote to leave the EU in the 2016 referendum, there has been a determination by politicians and policymakers – including in the Conservative Party – to better support so-called ‘left behind’ areas, which refers to a variety of post-industrial and coastal areas across England and Wales. 

When thinking about what would best help these ‘left behind’ areas, the UK public is also fairly split, though some options are notably more popular than others. As Chart 8 indicates, incentivising new businesses to move into such areas is the top choice among the UK public, with 42% supporting this. Investing more into public services is the second most favoured option and supported by 33%. In joint third is improving transport connections and funding training schemes, with both receiving support from 30% of the UK public. 

There is some variation across voters of different parties, with a majority of Conservatives viewing incentivising new businesses (51%) as one of the best ways to help people in ‘left behind’ areas, while Labour voters were more likely to choose investing in public services (44%). However, many of the prescriptions share relatively similar levels of support across the political spectrum.4. Public perceptions of the Conservative Party

The perceptions of the Conservative Party in the 2020s are quite varied, though their focus on Brexit has successfully entered public perception, with the description of ‘a Brexit party’ being the one used by most by UK respondents (39%). Chart 9 below demonstrates this. The next popular descriptions used are ‘an elitist party’ (27%) and ‘a far-right party’ (20%), but also ‘a one-nation party’ (16%).

It is worth noting that there is significant variation by how people voted in the last election, as Chart 9 highlights. Negative descriptions, especially of the Conservative Party being ‘elitist’ and ‘far-right’, are largely driven by voters of other parties. Conservative voters are more likely to report the Conservative Party as ‘a Brexit party’ (34%), ‘a one-nation party’ (31%), ‘a people’s party’ (25%) and ‘a moderate party’ (21%). Conclusion

This polling is a snapshot of UK public opinion at the start of the 2020s. It should be seen primarily as a warning for the Conservative Government, highlighting that the trust placed in it by its new voters in northern England and Wales is fragile. The Prime Minister is right to say that first-time Conservative voters have lent their support to him; he now needs to earn their trust.

Overall, the public is pessimistic about the direction of societal and economic issues over the next five years and believes that the Conservative Government will deliver on only some of the promises made during the 2019 general election campaign. There is a significant expectations gap on a range of environmental, social and welfare issues, with many wanting the Government to give them a higher priority than what is currently expected. 

At the same time, this polling suggests that the Conservative Government has significant room to exceed people’s expectations. The public’s policy priorities on helping those on low and middle incomes and left-behind areas are mostly in line with the Conservative Government’s agenda, including investing in key public services, improving transport connections and training opportunities, and attracting business investment. Should the Conservatives deliver on this domestic agenda, they are likely to maintain the trust of their new electoral coalition.

Anvar Sarygulov is a senior researcher at Bright Blue


Notes:

The full data tables for the polling can be found here.

We are grateful to Opinium for advising on and carrying out the survey.

Anvar Sarygulov: Labour should fix, not scrap, Universal Credit

By Anvar Sarygulov, Centre Write, Welfare

The release of Labour’s election manifesto confirms their desire to take a sledgehammer to Universal Credit. But Labour’s crusade against Universal Credit would be a significant step backwards in how our welfare system is designed. They would be far better off focusing on reform, rather than replacement.

It is difficult to understate the structural improvement that Universal Credit presents over the hodgepodge of benefits that preceded it. For example, in the legacy system, many families have to engage with three different government bodies to receive various benefits. This places a much greater burden on claimants, particularly if their circumstances change. In contrast, when Bright Blue interviewed Universal Credit claimants, there was a clear preference for a single payment from a single agency.

The incompatible and inconsistent eligibility rules across the variety of benefits in the legacy system meant that some claimants could be losing more than 90% of their new income when they worked more hours, disincentivising people from improving their situation. Universal Credit’s implementation ensures that any additional hours almost always leads to a consistent improvement, as benefit payments are withdrawn at a rate of 63p for every £1 increase in income, though local Council Tax support can complicate this. Incentives to work could be increased even further by lowering this rate, or by increasing the number and value of different work allowances to more claimants, which allow claimants to earn a certain amount without any withdrawal of benefits.

The above is not to say that the design of the Universal Credit is perfect. There are plenty of kinks to iron out, a number of which Labour has correctly identified. Forcing new claimants to wait five weeks for the first payment has been a disastrous decision, leading people into food bank usage, rent arrears and debt to cope with the wait. To the credit of the Conservatives, the introduction of ‘advances’ has alleviated some of the pressure by allowing claimants to receive money early, but the process of repaying them adds significant pressure on the already meagre finances of those households. Labour’s proposal to simply offer an interim payment will help to fully address this issue.

Labour is also correct in identifying the need for the ability to pay the housing element directly to the landlord and for the need for fortnightly payments of Universal Credit. Our interviews have shown that these are significant sources of concern for claimants and makes it more difficult for some to effectively budget. However, it is vital to emphasise the need for claimants to have the ability to make a choice on the frequency of payments; for many, the monthly payments are not an issue.

Notably, there’s nothing to stop Labour delivering their £8.4 billion welfare spending package through Universal Credit. Increasing the Local Housing Allowance, the Employment and Support Allowance or the rate of support for severely disabled people can all be easily achieved within the current system. Meanwhile, Labour’s desire to introduce greater ‘dignity’ and ‘respect’ into the system could be achieved simply by changing procedures.

Rather than wreck a system that fundamentally improves on its predecessor, it would be far better for Labour to build on it and modify it in pursuit of their vision of the welfare state. This will not only preserve the existing benefits of Universal Credit for those who claim it, but also ensure that they do not have to endure yet another overhaul of the welfare system.

Anvar Sarygulov is a Researcher at Bright Blue

Anvar Sarygulov: Brexit Party’s Exit

By Anvar Sarygulov, Centre Write, Politics

The announcement that the Brexit Party will not standing in all seats that the Tories won in 2017 has been seen by some as a game-changer. However, the most significant effect of Nigel Farage’s move is to increase the chances of a 2017 General Election redux.

By shoring up the defence of Conservative-held seats, but continuing to bleed Leave voters off in Labour-held marginals that the Conservatives need to win for a majority, a path to a hung parliament where Conservatives are the largest party is clearly visible. To understand why, let’s look at some London marginals.

We can use the data from an MRP model and polling constructed by Focalpoint this Autumn, which estimates party vote share at constituency level. An MRP model combines a large polling dataset (46,000 in this case) with the socio-demographic profile of each constituency to estimate a voting share in each seat. Focalpoint’s data is both plausible and reasonable given other polling data we have, so we will use it to illustrate the dynamics at play in London.

First, lets consider the supposed benefit of Brexit party candidates standing down to Conservative incumbents in London.

Table 1: Projected share for 2019 for Conservative-held seats in London where the winning share is <40%.

Seat Con 2019 Lab 2019 LD 2019 BXP 2019 Green 2019
Chelsea and Fulham 37.9 17.5 30.2 5.9 6.2
Harrow East 37.7 29.1 15.1 10.0 5.5
Chingford and Woodford Green 37.4 26.1 19.8 9.8 4.7
Finchley and Golders Green 36.0 25.1 26.2 5.0 5.4
Wimbledon 35.9 21.1 29.5 5.0 6.2
Cities of London and Westminster 35.8 22.3 27.0 4.9 7.7
Putney 35.1 22.1 27.2 4.7 8.7
Hendon 34.3 23.6 26.8 8.3 4.7
Chipping Barnet 33.2 26.8 25.0 7.8 5.0
Average change 2017-2019 -11.8 -17.7 17.3 6.1* 4

*Change from UKIP 2017 result

Source: Best for Britain, aggregated by Chris Hanretty (2019)

All of these marginal constituencies had majority support for Remain in the 2016 Referendum, some by an overwhelming margin (72.2% voted to Remain in Putney). Despite the heavily Remain profile of these constituencies and the average vote share loss of 11.8% from 2017, the Conservatives still are predicted to have at least a 6% margin on the second-place opponent in every constituency even if a Brexit Party candidate is standing. Hence, the benefits of the Brexit Party to stand down are small in Conservative-held seats due to the already significant polling lead.

But, should either Labour or Liberal Democrats surge, the decision by the Brexit Party will provide a benefit by shoring up Conservative margins. It must be noted, though, that the Conservatives are not guaranteed to get all Brexit Party voters, as can be seen with the experience of UKIP. In the 2017 Election, the Conservatives managed to secure less than half (45%) of people that voted UKIP in 2015, meaning that some could choose a different party. Furthermore, some Brexit Party supporters might simply choose to stay at home, just like the 30% of 2015 UKIP voters. So, the Conservatives should be carefully not to overestimate the potential boost.

In contrast, we should compare the effect of the Brexit Party continuing to stand in Labour-held marginals in London:

Table 2: Projected share for 2019 for Conservative targets in London held by Labour

Seat Con 2019 Lab 2019 LD 2019 BXP 2019 Green 2019
Croydon Central 33.7 31.0 14.6 12.1 6.3
Ilford North 33.1 36.8 13.4 10.9 3.6
Dagenham and Rainham 32.5 32.8 8.6 19.7 4.4
Enfield, Southgate 32.1 29.6 20.8 8.0 7.4
Eltham 31.8 30.9 16.7 13.0 5.5
Kensington 31.1 22.8 29.7 7.8 6.7
Battersea 31.0 25.5 31.2 3.8 6.6
Brentford and Isleworth 30.9 32.9 20.9 8.8 4.6
Average change 2017-2019 -8.8 -21.2 14.8 9.3* 4.7

*Change from UKIP 2017 result

Source: Best for Britain, aggregated by Chris Hanretty (2019)

As can be seen, the Conservatives could secure even heavily-Remain marginals such as Kensington and Battersea even with Brexit Party presence on their path to a majority. However, this is completely dependent on the Remain vote to be split and with retention of a large polling lead. The Conservatives in such seats are hostages to fortune and will have little chance to retake such seats if Labour has a resurgence by regaining voters from the smaller parties, which would be unsurprising.

The Conservatives also have a tough contest in the heavily-Leave seat of Dagenham and Rainham, as the Brexit Party siphons off Leave voters primarily from the Conservatives. It is indicative of the struggle that the Conservatives will face in many other traditionally Labour seats across the country, especially in Northern England and Wales, that had voted to Leave if the Brexit Party continues to stand there.

The Brexit Party decision to stand down in Conservative-held seats has some benefit of shoring up their margins, which will become more important if the Conservatives start to lose their significant lead. However, by continuing to stand in the Labour-held marginals that Tories need to win for a majority, it is easy to see how we can face a hung parliament similar to the one we have now if Labour vote strengthens even slightly.

Anvar Sarygulov is a Researcher at Bright Blue

Anvar Sarygulov: Sharing the good news? The impact of shared ownership reforms

By Anvar Sarygulov, Centre Write, Housing & Homelessness

Shared ownership, where an individual buys a share of a house and then pays rent on the remaining share, has become an increasingly attractive affordable housing option, with around 200,000 households living under such arrangements.

Recently, there was a confirmation by the Secretary of State for Housing that there will now be a ‘Right to Shared Ownership’ for housing association tenants in newly built dwellings, allowing them a minimum initial stake of only 10%, in comparison to 25% for other shared ownership schemes. Furthermore, all shared ownership owners will now be able to buy additional shares of their home in 1% bits, rather than 10%, a practice known as ‘staircasing’. In theory, both changes should increase the accessibility of home ownership.

In terms of the initial share, there’s evidence that the existing rules already significantly lower barriers, primarily due to reducing the size of the mortgage that the buyer has to borrow. For example, the absolute minimum annual income required to obtain a mortgage for a £230,000 home is £48,600 with a 5% deposit, whilst with 25% shared ownership it is only £21,600. However, only 5% of shared ownership buyers were social housing tenants before their purchase, while 85% were private renters or were living with friends and family before buying. So, up to now, the scheme has been mostly inaccessible to those living in the social rented sector.

While lowering the minimum share to 10% reduces the size of the initial mortgage even further, this is still unlikely to be of significant help to most housing association tenants. Recent official surveys show that the average weekly income of a housing association household is £412, in comparison to £728 of private renters and £941 for owner occupiers. So, unsurprisingly, 83% of social renters do not have any savings at all. While 12% of social renters had more than £1,000 savings, making it possible that they could benefit, it is important to note the age distribution of this group, with majority (67%) of such people being 55 or older, who are also unlikely to benefit from this scheme.

In contrast, the changes to the staircasing could be quite significant to potential and existing shared ownership buyers. Currently, staircasing is an uncommon practice, with only 0.6% of shared ownership households partially staircasing and 1.3% staircasing to own the property fully in 2016. The transaction costs are a significant factor in dissuading staircasing, as buying each share is accompanied by survey, legal and mortgage fees, while some housing associations also limit the number of times a household can staircase. This forces households to wait as long as possible until they buy an additional share, but this means that some, particularly in London and South East, are priced out as house prices outgrow earnings. Allowing people to buy shares as small as 1%, along with the promised streamlining of fees, should greatly decrease the barriers to staircasing.

The new ‘Right to Shared Ownership’ is unlikely to have significant impact as the number of housing association tenants who could benefit from the new scheme is small. For better or worse, this is not the ‘Right to Buy’ for housing association tenants that Conservatives have repeatedly considered. Much more attention should be paid to the changes to staircasing and whether they encourage significantly higher rates of partial staircasing. It is here where a genuine increase in homeownership could be observed.

Anvar Sarygulov is a researcher at Bright Blue

Anvar Sarygulov: Time for action: improving transitioning to Universal Credit

By Anvar Sarygulov, Centre Write, Welfare

By the end of 2023, more than 6.5 million people are forecast to be claiming Universal Credit (UC), yet in May 2019 only 1.8 million were. Over the next couple of years, millions of people on legacy benefits will be transferred to the new system, making it vital that the new PM ensures the transition is as painless as possible. 

The process of ‘natural migration’ is transferring people from legacy benefits to UC without any government action. ‘Natural migration’ occurs when a change in circumstances forces a claimant of legacy benefits to make a claim for UC. While some such changes in circumstances significantly affect what a person can claim, such as having a first child, other changes which force natural migration are less drastic. These include moving to a different local authority or becoming a carer. 

In contrast, ‘managed migration’ will occur when the Department for Work and Pensions (DWP) starts moving claimants to UC without them having any change in circumstances, a process which the DWP is currently trialling in North Yorkshire with 10,000 claimants.

Unsurprisingly, the rate of natural migration has increased after UC was fully rolled out across the country in December 2018. The latest DWP figures show that between December 2018 and May 2019, the number of UC claims with a housing element has increased by 299,000. In the same period, the amount of active housing benefit claims has fallen by 255,000. Indeed, the vast majority of legacy benefit claimants will move to UC due to natural migration by 2026, though the Government expects to finish managed migration by December 2023 for all claimants.

People who are naturally migrating are forced to wait five weeks before receiving their first UC award. Bright Blue research has identified this as the most problematic design element of UC. A majority of claimants do not have access to any significant savings, which means that many have to rely on family and friends for financial support, while others fall into commercial debt or face rent and bill arrears.   

The Government has already made some efforts to smooth out the natural migration process. For those who claim Housing Benefit and are moving to UC, the Housing Benefit is paid for an additional two weeks whilst they are moved to the new system. All claimants also have an option to request an advance payment while waiting for their first UC award. However, this advance payment has to be repaid from future UC payments and this reduction can negatively impact low-income households who already have significant difficulties budgeting month-to-month.

The Government is also introducing a two-week run on Jobseeker’s Allowance and Income Support for those first transitioning onto UC, but this will only come into effect from July 2020, by  which time thousands of claimants on these benefits will migrate without such support. Bringing forward the introduction of this measure is important to assist those who are naturally migrating. 

The new Government should also follow the recommendation that we have set out in our report on UC, Helping Hand?, and provide a one-off upfront payment worth at least 25% of their initial UC award as soon as a claimant first comes onto UC. In combination with the above measures, managing the five-week wait period should be much easier for those migrating from legacy benefits and for new claimants.

Another major issue is the lack of transitional protection for claimants who are naturally migrating. Applicants who will be moved to UC by DWP and stand to lose out financially will receive an extra award to ensure that they are not worse off as a result of the transition. The IFS estimates that around 40% of individuals transitioning to UC will lose at least £100 per annum and 17% will lose more than £1,000. The latter category includes 24% of all lone parents and 14% of all individuals in work on legacy benefits. For low-income households, such a sudden loss of income is likely to be a major shock and cause financial hardship while the household adjusts. 

While it would be impossible to provide transitional protection to all those naturally migrating to UC, as many changes in circumstances can entail significant shifts in their entitlements, the Government should at least consider providing such protection where the change has not had a significant impact on a person’s benefit award. Furthermore, the Government should also offer such transitional protections to those who are choosing to move to UC of their own accord. This would remove the incentive for many claimants to wait until they are migrated by the Government and ensure that transitional protection is available to all who need it. 

UC has been beset by numerous problems since its very beginning, and it is vital to take them as valuable lessons. With millions of people moving to UC in the next few years, now is the best time for the new PM to take rapid action on UC to ensure that these people do not encounter the problems that have already been identified and do not have to suffer as they transition to the new system.

Anvar Sarygulov is a Researcher at Bright Blue. Image licensed under the Open Government Licence v1.0.

Anvar Sarygulov: Super-divided or super-diverse?

By Anvar Sarygulov, Centre Write

Previous academic research has strongly suggested that two significant negative influences on levels of social integration are is higher levels of ethnic diversity and poor English proficiency of newcomers. The latter relationship is particularly unsurprising, considering that we should expect language barriers to create significant difficulties for interactions between people.

However, new research in Bright Blue’s new report, Distant neighbours? Understanding and measuring social integration in England, suggests that the effect of ethnic diversity and English language proficiency might be more complex than previously believed.

As can be seen in Table 1 below, in local areas where less than 30% of migrants cannot speak English well, higher levels of ethnic diversity in a local area are indeed associated with decreasing levels of neighbourhood trust. In such areas which are the least ethnically diverse, 40% of individuals are predicted to trust most of their neighbours, while in such areas the most ethnically diverse, only 37% of individuals are predicted to trust most of their neighbours. Here, we observe a marginal decline in neighbourhood trust as ethnic diversity increases.

Table 1. Predicted trust in a local area, by ethnic diversity and level of English proficiency of migrants

Levels of predicted neighbourhood trust
Ethnic diversity decile Less than 30% of migrants cannot speak English well More than 30% of migrants cannot speak English well
1 (10% least diverse areas) 40% 37%
10 (10% most diverse areas) 37% 51%

Source: Based on Citizenship Survey, pooled 2009-10 and 2010-11 (secure access) and Census 2011 data

Note: a local area is defined as a middle-layer super output area (MSOA) a standardised geographical unit used in the census which contains an average of 7,200 people

However, in local areas where more than 30% of migrants cannot speak English well, an increase in ethnic diversity is associated with a predicted increase in levels of neighbourhood trust. In local areas which are the least ethnically diverse, 37% of individuals are predicted to trust most of their neighbours, while in such areas which are also the most ethnically diverse, 51% are predicted to trust most of their neighbours.

These are surprising findings. First, the increase in ethnic diversity is associated with an increase in neighbourhood trust for this group of local areas. Second, ethnically diverse areas are predicted to have higher levels of neighbourhood trust when a greater proportion of migrants is unable to speak English well. Both of these relationships contradict the expectations borne out of previous research.

What are the plausible explanations? Our report notes of two:

  • Ethnically diverse local areas with a high number of migrants who are unable to speak English well are also areas which are more likely to be residentially segregated. Those who live in residentially segregated areas are more likely to report trusting neighbours, as their immediate neighbourhoods are formed of people who are similar to them
  • Ethnically diverse local areas with a high number of migrants who are unable to speak English are ‘super-diverse’, where people are more used to immigration, ethnic diversity and dealing with people who do not speak English well, making it easier to form relationships even across language barriers

To examine these explanations, we should consider the local authority Sandwell.

Sandwell is a metropolitan borough in West Midlands, located immediately west of the City of Birmingham. Across the entire local authority, 35.5% of migrants describe themselves as unable to speak English well, or worse, when asked about their English proficiency. This tendency is distributed evenly across the borough, with 24 out of 38 local areas having this proportion at 30% or above. Sandwell also has an Ethnic Diversity Index of 0.50, putting it in the 9th decile for ethnic diversity in England. Once again, the local areas of Sandwell are also overall diverse, with 19 out of 38 being in the 9th or 10th decile of ethnic diversity and no local area being placed lower than the 6th decile.

It is also important to note that according to the independent statistical analysis in our report, Sandwell has a predicted trust level of 24.2%, putting it in the bottom decile for predicted trust in local authorities. As the statistical analysis accounts for a large number of other properties, such as socio-demographic profile of individuals and other area factors such as deprivation, this suggests that despite Sandwell being both very ethnically diverse and having a high proportion of migrants who cannot speak English well, the combined positive effect of this on trust is insufficient to counter-balance the negative effect of other factors.

First, let’s examine the state of residential segregation in Sandwell. Sandwell’s Index of Dissimilarity, a widely used measure for residential segregation, is 43.4, which places it in the 10% most segregated local authorities in England. This can also be observed visually by examining the distribution of ethnic groups across the local authority.

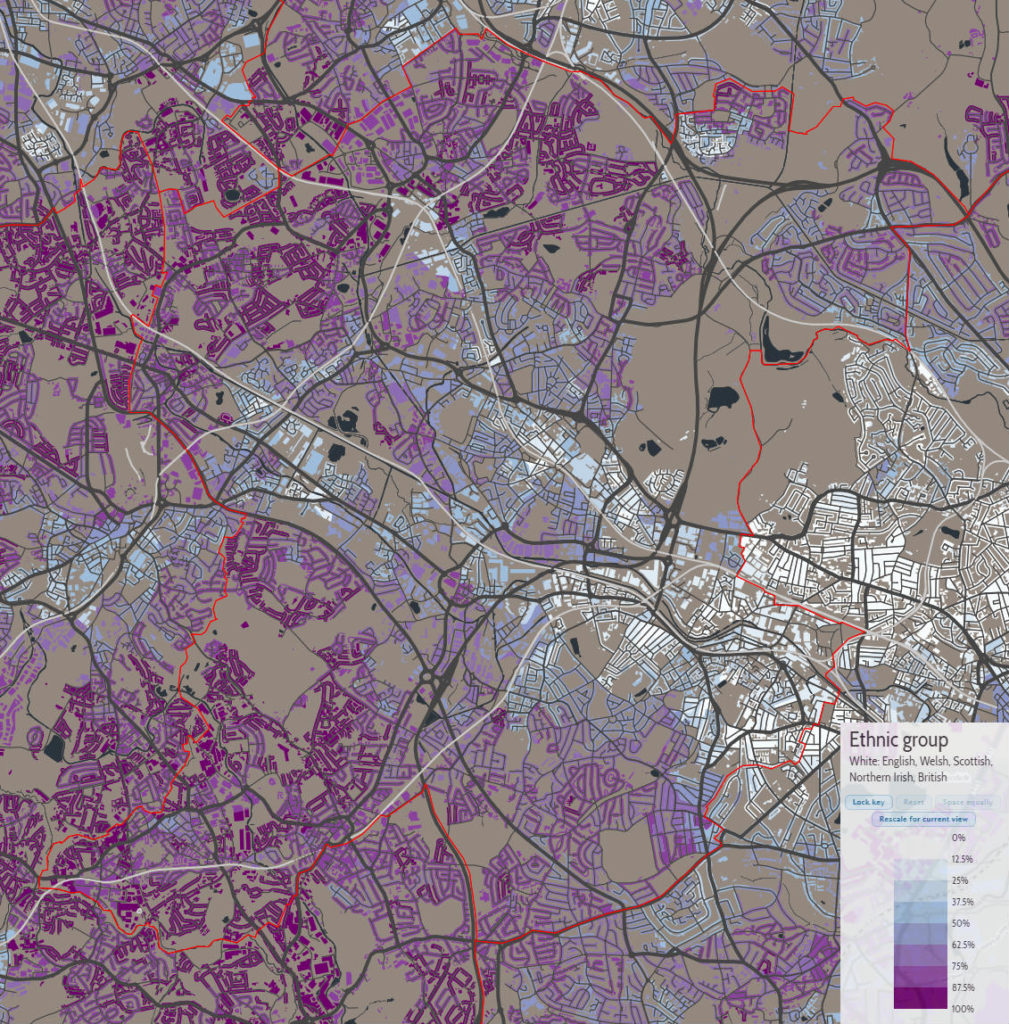
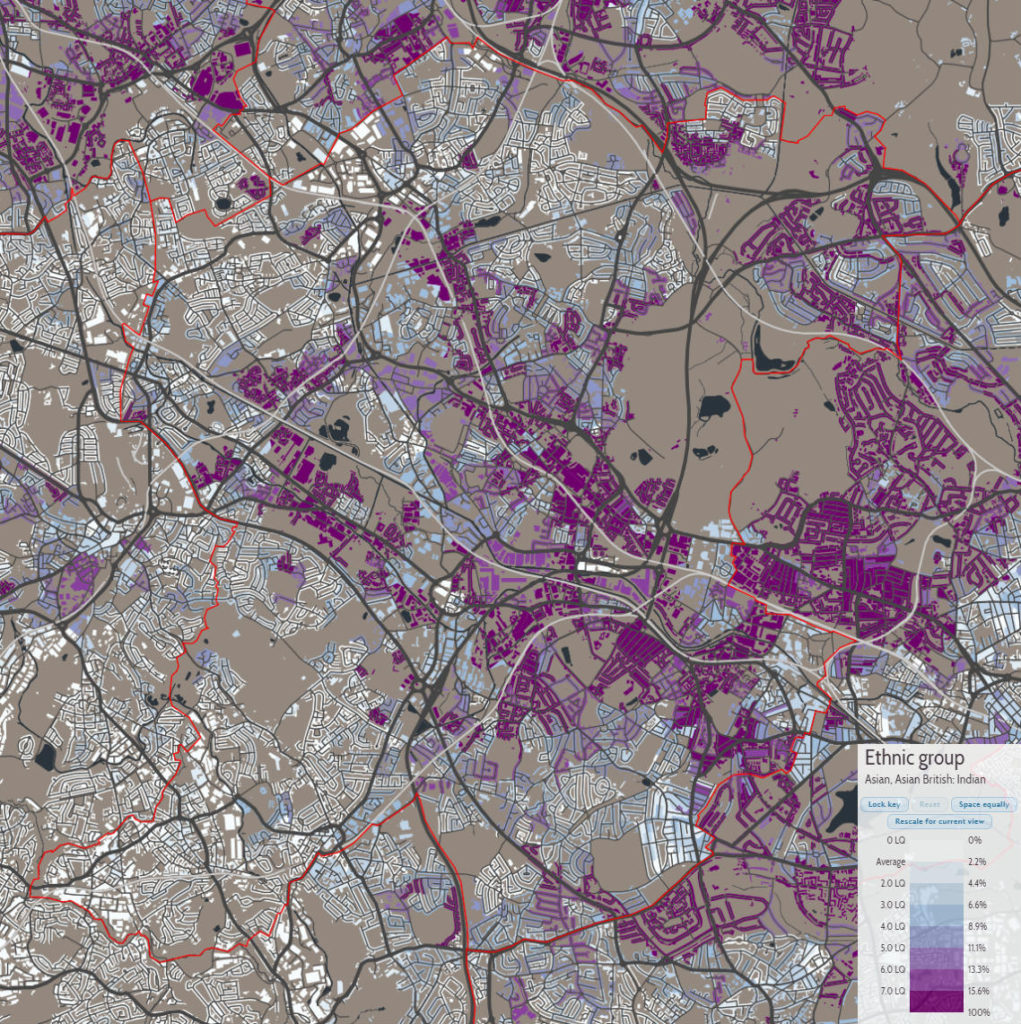
Figure 1 illustrates the two biggest ethnic groups in the local authority: White British (65.8% of local authority population) and Asian British Indian/Asian Indian (10.2%). We can clearly observe a pattern of residential segregation in the local authority when looking at these figures side by side; while White British population is above 75% in the majority of southern and northern sections, it falls below 50% in the majority of the centre of Sandwell. The pattern for Asian British Indian/Asian Indian group is a complete inversion: above 15.6% in most of the central section, but below 2.2% in many of the northern and southern areas of Sandwell.

Figure 1. Distribution of White British (left) and Asian British Indian/Asian Indian (right) in Sandwell, 2011


Source: Datashine, Census 2011 and Office for National Statistics

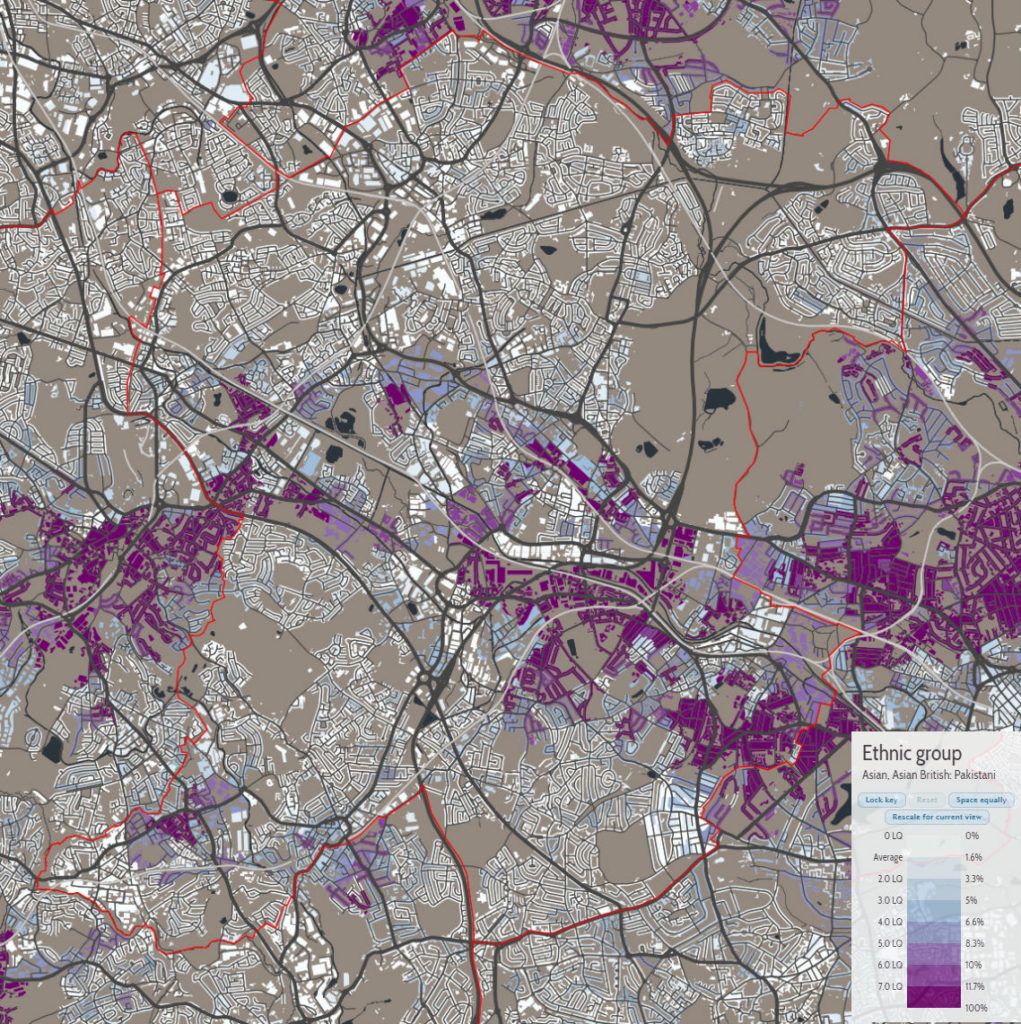
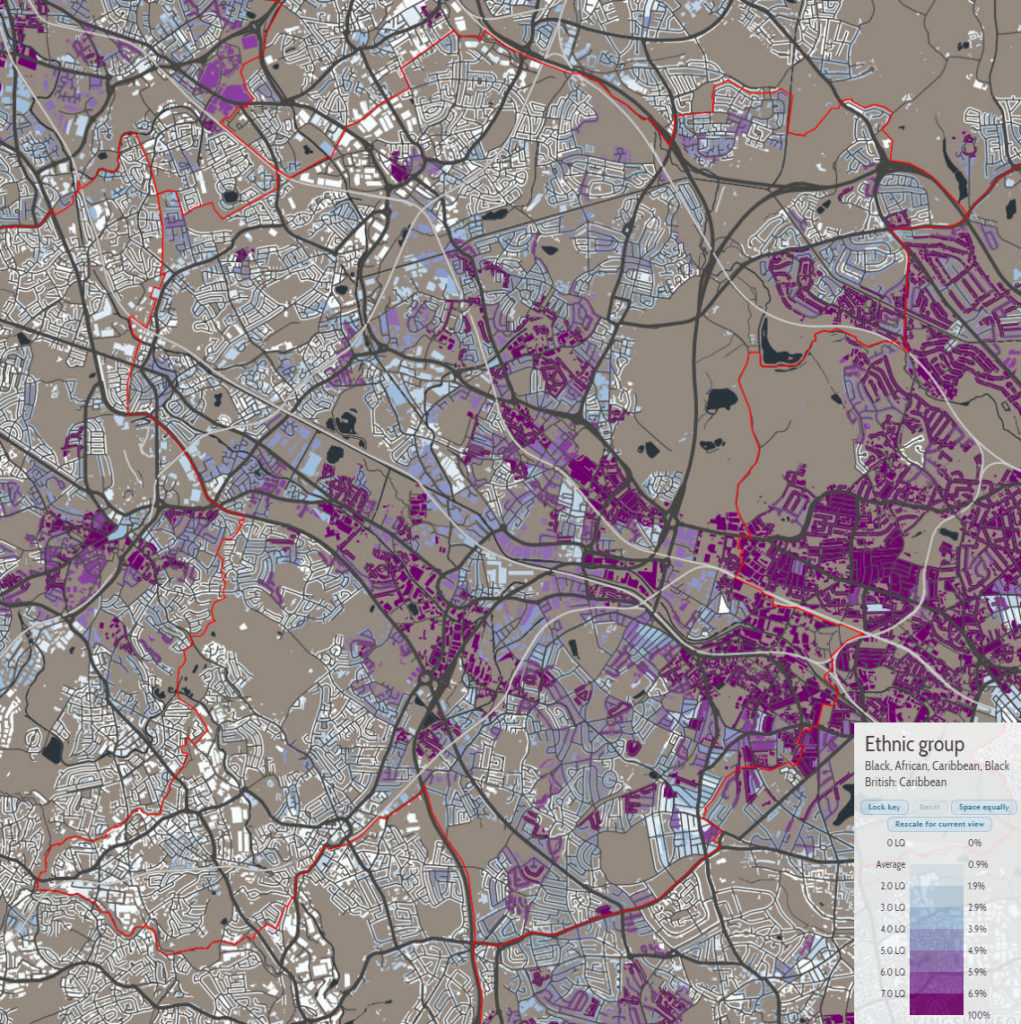
Figure 2 below illustrates the third and fourth biggest ethnic group: Asian British Pakistani/Asian Pakistani (4.5%) and Black British Caribbean/Black Caribbean (3.7%), mainly to highlight that this pattern is not exclusive to one ethnic group, with both of these ethnic groups also clustered primarily in the centre of Sandwell. The presence of significant residential segregation provides support for the first explanation in our recent report, as despite living in an ethnically diverse areas, many also live alongside neighbours who are very similar to them.

Figure 2. Distribution of Asian British Pakistani/Asian Pakistani (left) and Black British Caribbean/Black Caribbean (right) in Sandwell, 2011


Source: Datashine, Census 2011 and Office for National Statistics

Furthermore, Table 2 below shows the results in the 2005 and 2010 general elections for the British National Party (BNP). As can be seen, in the Sandwell constituencies where BNP stood in 2005 and 2010, BNP performed above the national average, while the rank of performance indicates that these constituencies were some of the best performing for BNP.

Table 2. BNP vote share at general elections in Sandwell constituencies

Constituency 2005 2005 rank of performance 2010 2010 rank of performance
Warley 5.5% 26/119 Did not stand N/A
West Bromwich East 6.6% 16/119 5.8% 50/339
West Bromwich West 9.9% 4/119 9.4% 5/339
Halesowen and Rowley Regis* Did not stand N/A Did not stand N/A
National average (in constituencies where BNP stood) 4.3% 3.8%

*Partly in Sandwell, partly in Dudley

The success of BNP raises questions about the viability of the second explanation. As noted by previous research, support for BNP is associated with considerable anxiety about immigration and perceptions of conflict between the White British and minorities which are predominantly Muslim. Hence, Sandwell appears unlikely to be a place where there is a general attitude of being used to immigration, ethnic diversity and dealing with people who do not speak English well, as the disproportionate support for BNP indicates very much the opposite.

The above evidence should only be taken as indicative. Further analysis, either statistical or qualitative, is necessary to establish the most likely explanation to our peculiar findings. However, the evidence mentioned suggests that the positive relationship between neighbourhood trust and lack of English proficiency is probably masking a more troubling and concerning effect, such as residential segregation.

Anvar Sarygulov is a researcher at Bright Blue

Nationalisation or privatisation?

By Anvar Sarygulov, Home, Podcast, Ryan Shorthouse

This edition of our Heads apart? podcast asks: Nationalisation or privatisation? We explore whether the trend of privatisation that began under Thatcher has worked or whether it is time to nationalise some industries. We are joined by Sam Bowman, Associate at Fingleton Associates and former Executive Director at the Adam Smith Institute, and Cat Hobbs, founder and director of We Own It, an organisation that campaigns for public ownership of public services.

Political analysis today can be shouty and superficial, with people shaming and stereotyping those who disagree with them. We defiantly take a different approach. Our podcast brings together people with different views to engage in respectful, thoughtful and detailed discussion on major political and cultural issues.

Music credit: Lights by Sappheiros

Presented by: Ryan Shorthouse | Produced by: Anvar Sarygulov