Introduction
We are now reaching the mid-term of the current Conservative Government, over two years since Prime Minister Boris Johnson secured a landslide victory in the 2019 General Election. This period in any government’s lifecycle is often the most precarious. But the simmering displeasure over rising cost of living and the fury over pandemic rule-breaking inside Number 10, now pose a significant threat to a Prime Minister who delivered an 80-seat majority only a few brief years ago.
As we go into this new and already politically turbulent year, it is worth considering how the public assesses the performance of the current Government so far, what they think Government priorities will be in 2022, their views on the best way to help low- and middle-income people and businesses, and on how prepared the Government is for major challenges in the year ahead.
To answer these questions, we have conducted public polling in partnership with Techne UK.
Methodology
Polling was undertaken by Techne UK and conducted between 17th and 28th December 2021. It consisted of one nationally representative sample of 2,036 UK adults. From this overall sample we also have unweighted subsets of those who have voted for the Conservatives (511), Labour (393) and Liberal Democrats (140) in the 2019 General Election. The sample was weighted by Techne UK to reflect a nationally representative audience.
A link to the full data tables and detailed polling methodology can be found at the bottom of this piece.
Performance since December 2019
In 2019, the Conservatives won record levels of support amongst those who are on low incomes. However, as Chart 1 below indicates, the UK public overwhelmingly thinks they have become worse off since the last General Election.
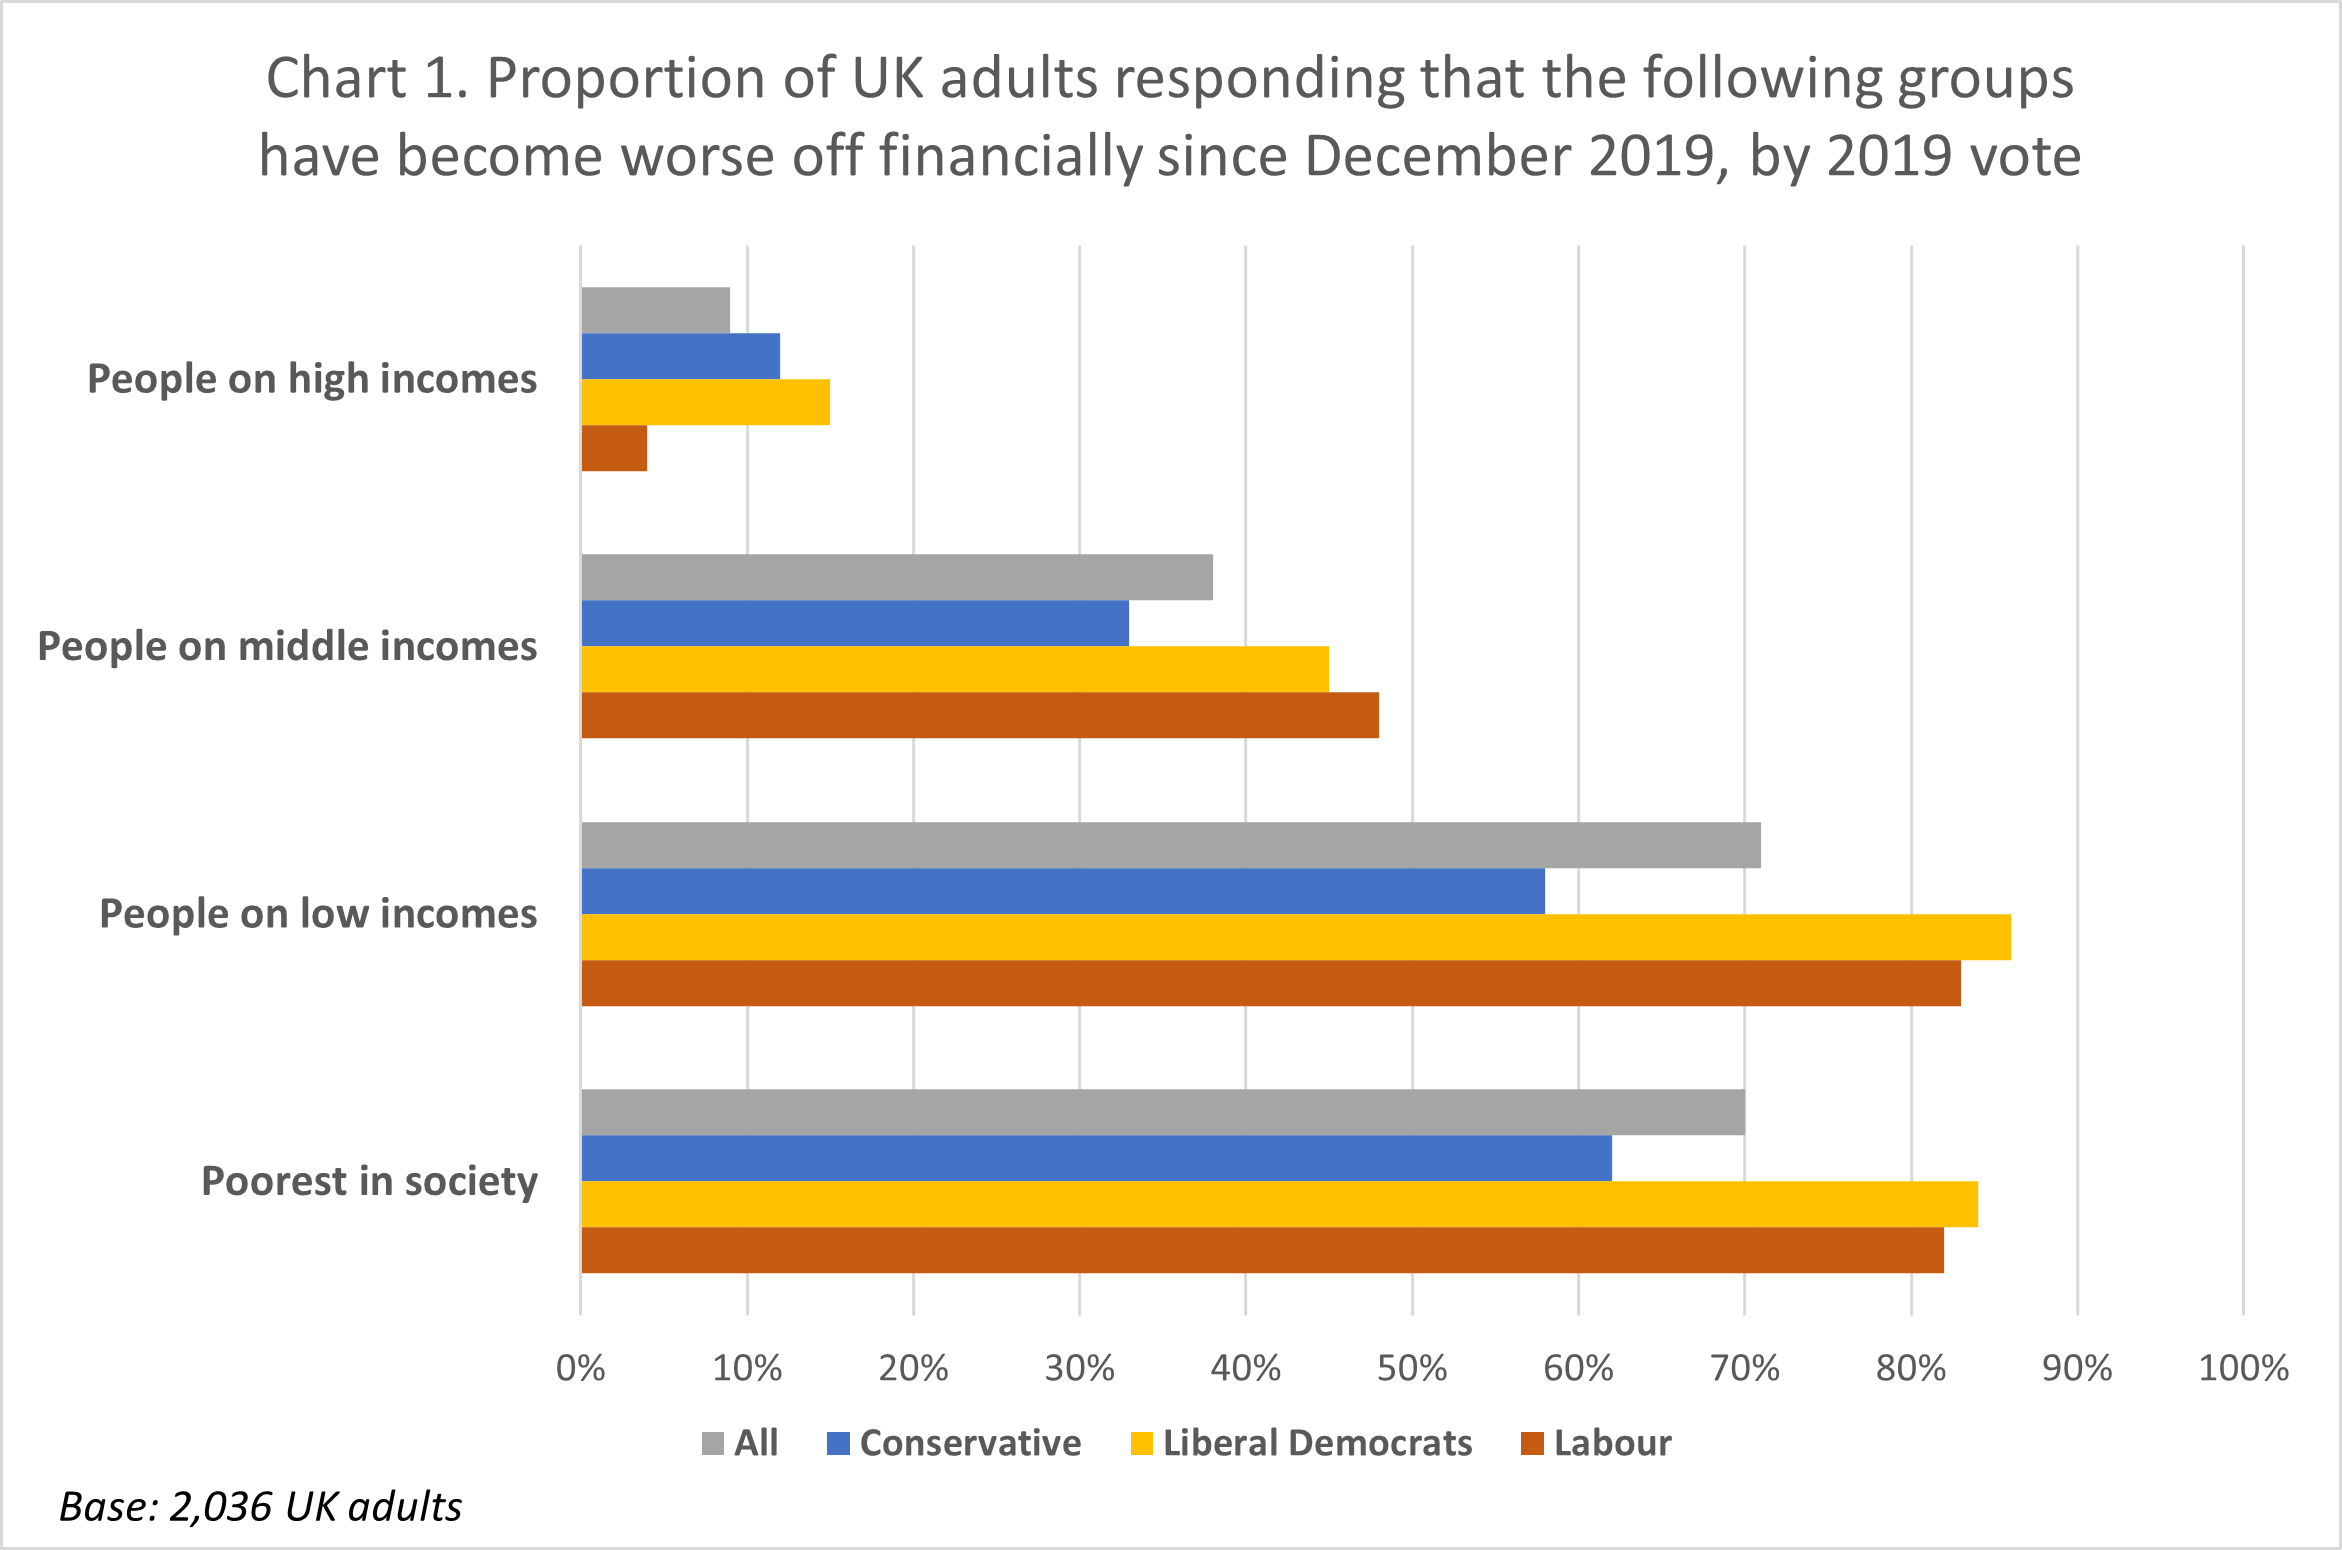 The UK public clearly thinks that more affluent income groups have been less likely to suffer financially since the last general election, with very few people (9%) thinking that those on high incomes have become financially worse off since December 2019, a significant minority (38%) thinking that people on middle incomes have become financially worse off, and large majorities thinking that those on low incomes (71%) and the poorest (70%) have become financially worse off since December 2019.
There is also consensus across different groups of voters in identifying that many income groups are facing financial hardship, including people on low incomes and the poorest in society: 58% of 2019 Conservative voters think people on low incomes have become worse off financially since the last general election, and 62% of 2019 Conservative voters think the same about poorest in society, in comparison to 83% and 82% of 2019 Labour voters respectively.
The current Government also gets poor marks from the public on addressing key policy issues, as shown in Chart 2 below, which shows the net view (proportion of respondents saying they have been better than expected minus proportion of respondents saying they have been worse than expected) across all parties.
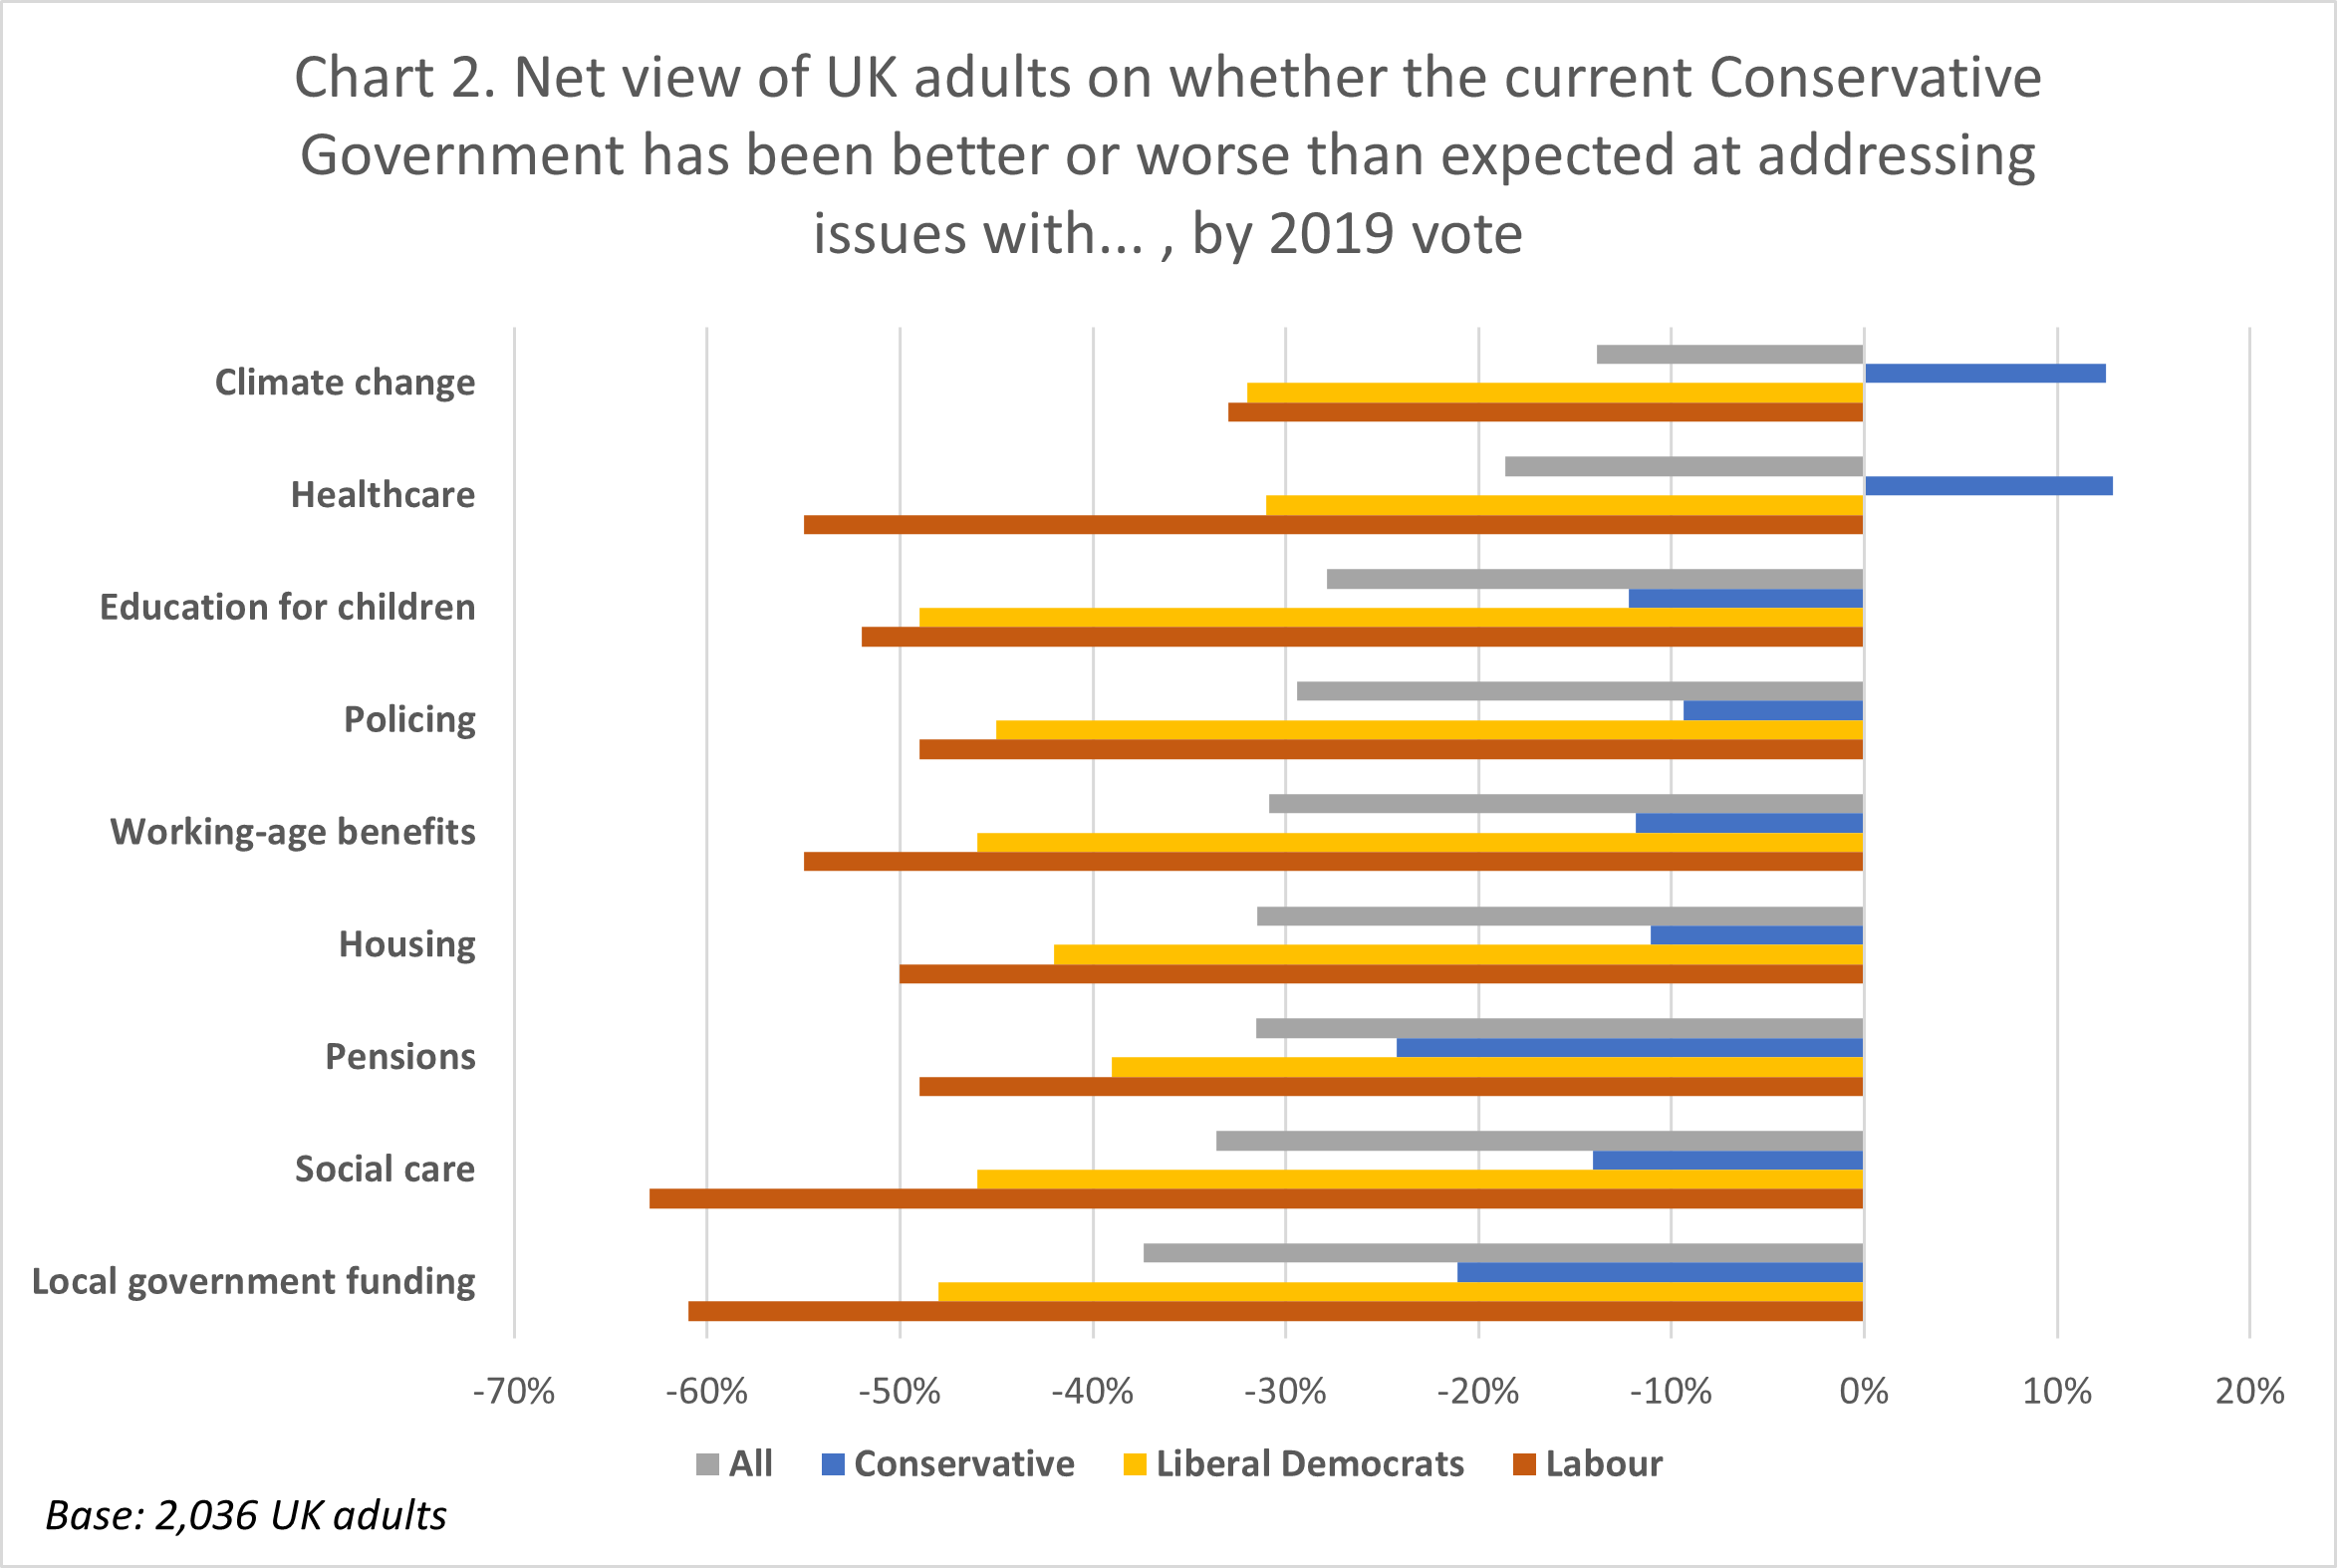 The UK public is more likely to say that the Government has been worse, rather than better, than expected on all the key policy issues polled. Notably, climate change (-14%) and healthcare (-19%) receive the highest net score, while local government funding (-37%) and social care (-34%) receive the lowest net scores.
Interestingly, 2019 Conservative voters give a net positive view only on two policy issues: climate change (13%) and healthcare (13%). These voters give the Government’s performance on all other areas a net negative score, with local government funding (-21%) and pensions (-24%) being the lowest. Unsurprisingly, 2019 Labour voters view the current Government as strongly underperforming, with climate change (-33%) receiving the highest net score and coming notably higher than others, while social care (-63%) receives the lowest score.
Priorities for the Government in 2022
The UK public is somewhat divided on what they think will be the main priority for the current Government in 2022, as shown in Chart 3 below.
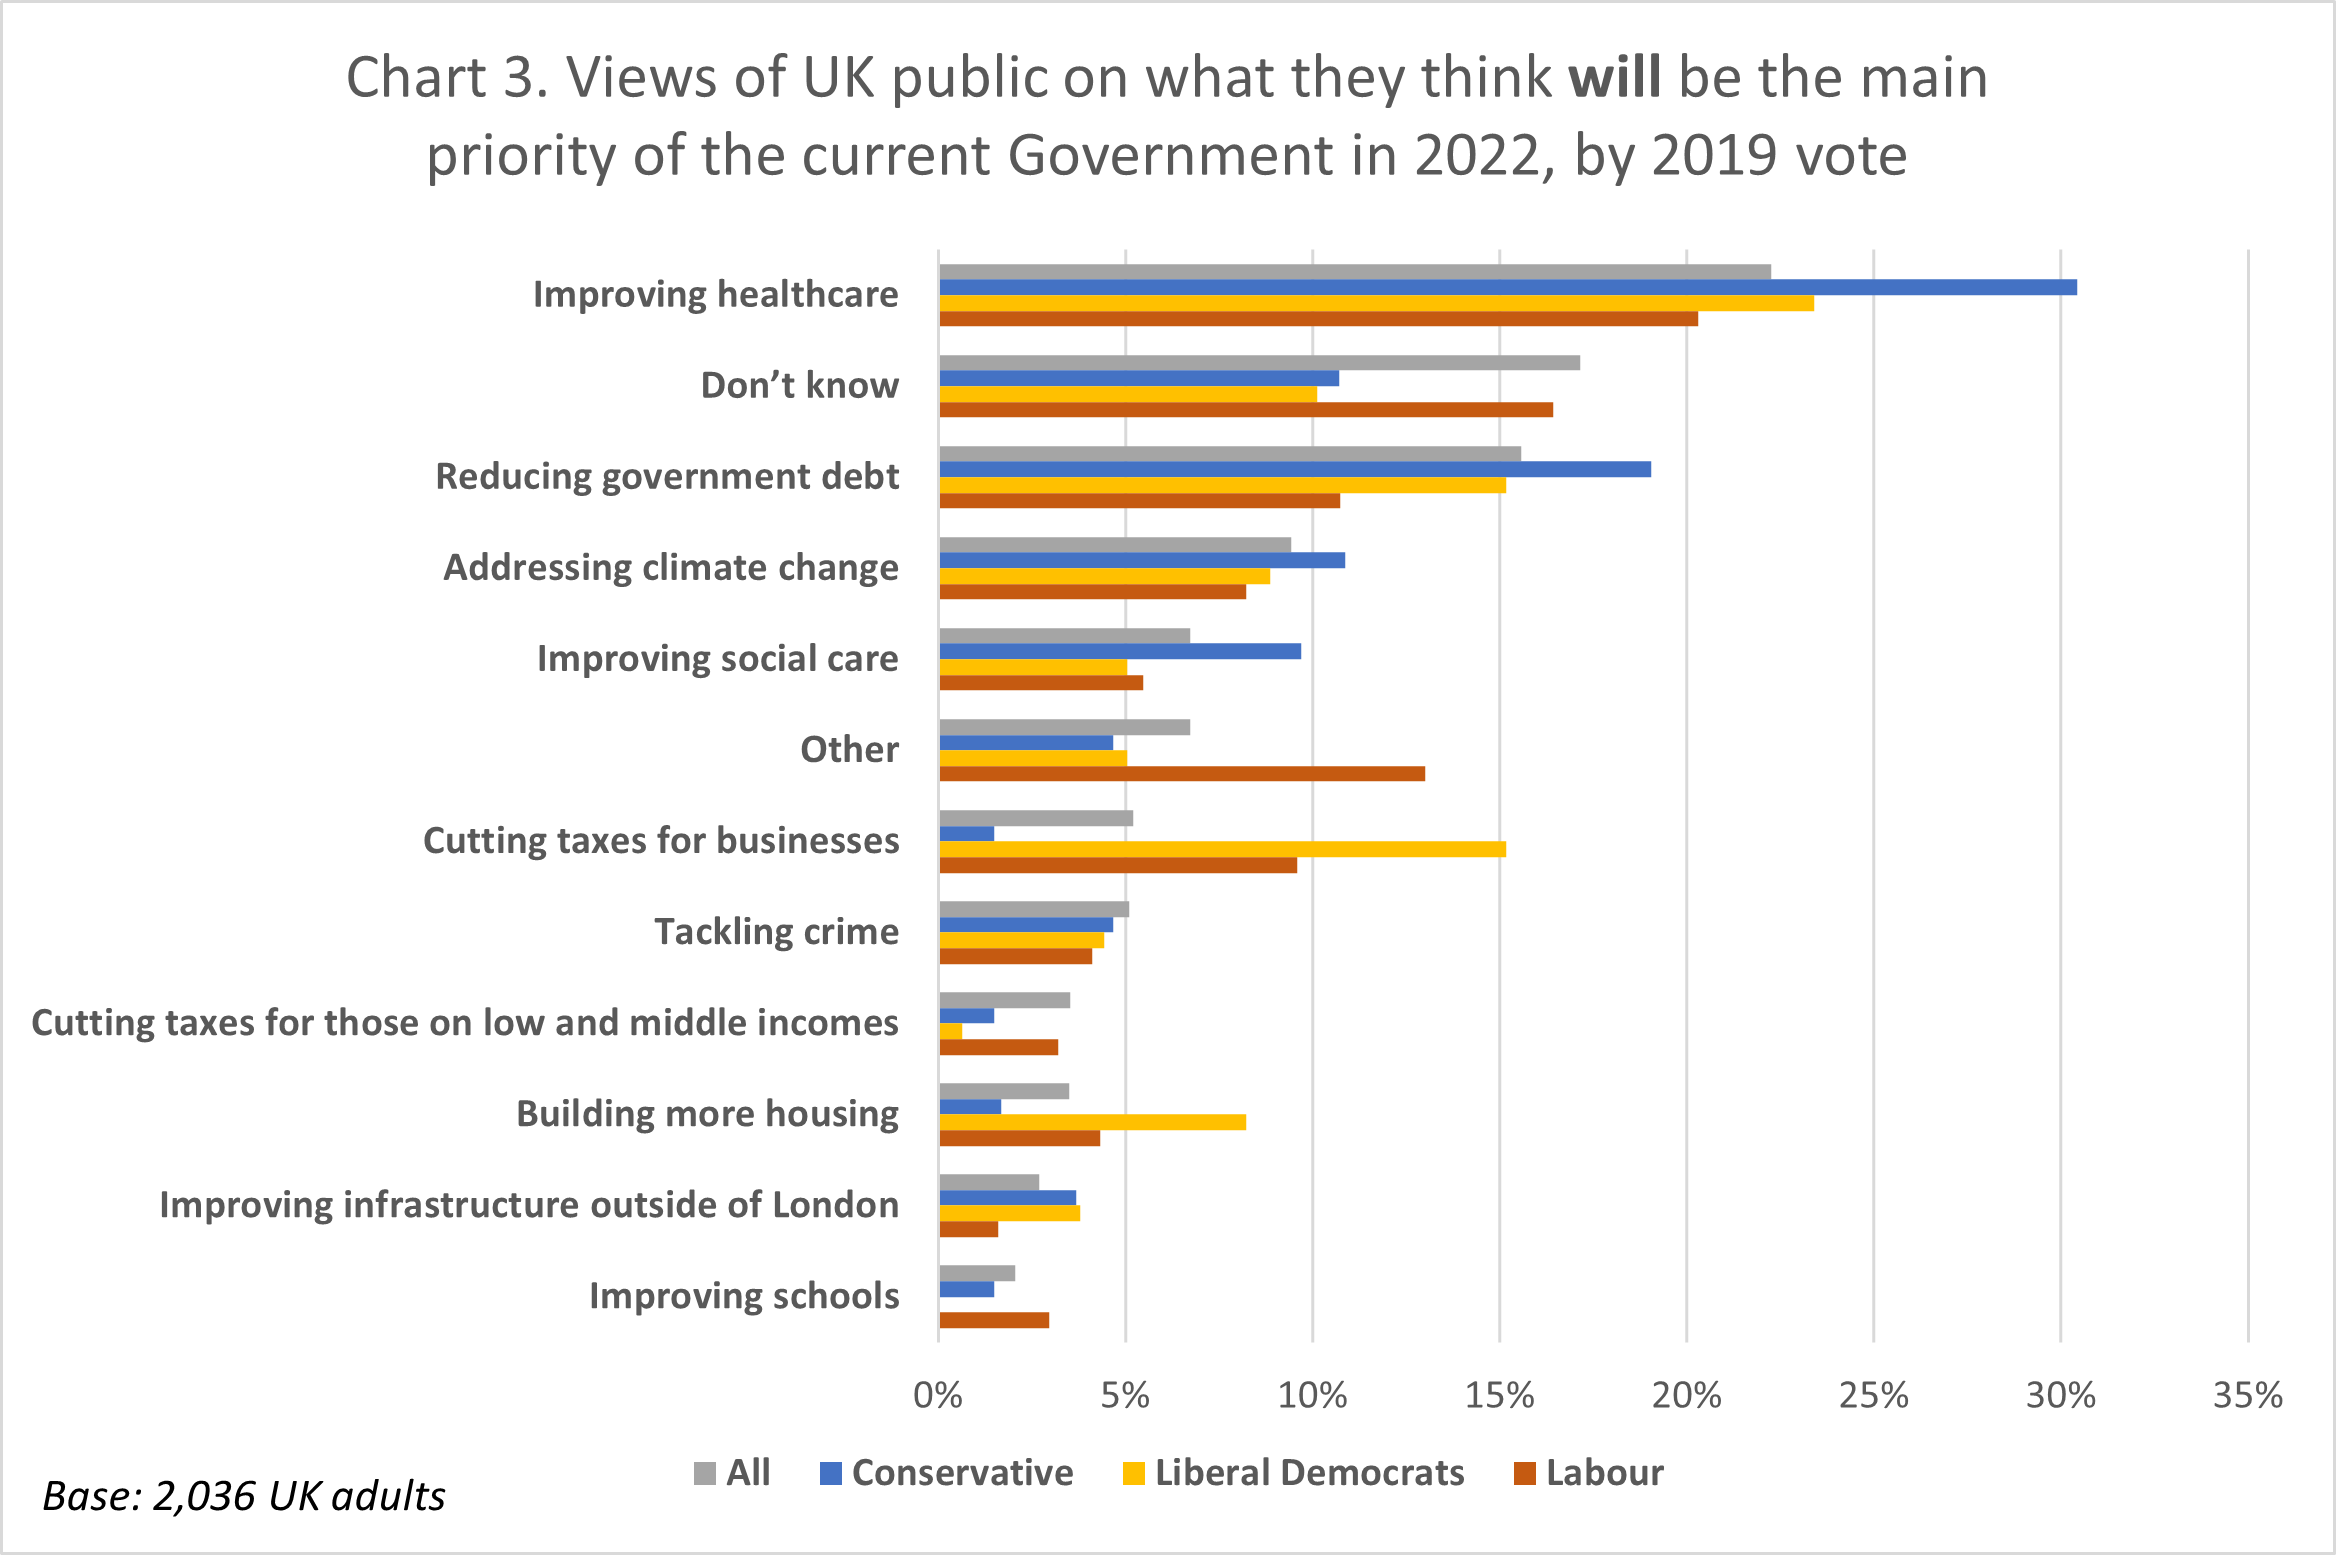 Improving healthcare is seen as the most likely main priority of the current Government in 2022, with 22% of the UK public thinking that this will be the main priority. This is more likely to be said by 2019 Conservative voters (30%) than 2019 Labour voters (20%).
Reducing government debt is seen as the second most likely main priority by the UK public (16%) and by 2019 Conservative voters (19%), while addressing climate change is seen as the third most likely (9%) by the UK public and the 2019 Conservative voters (11%). However, it should be noted that a substantive minority (17%) responded “don’t know” to this question.
There is some similarity with the above to what the UK public thinks should be the main priority for the Government in 2022, as shown in Chart 4 below.
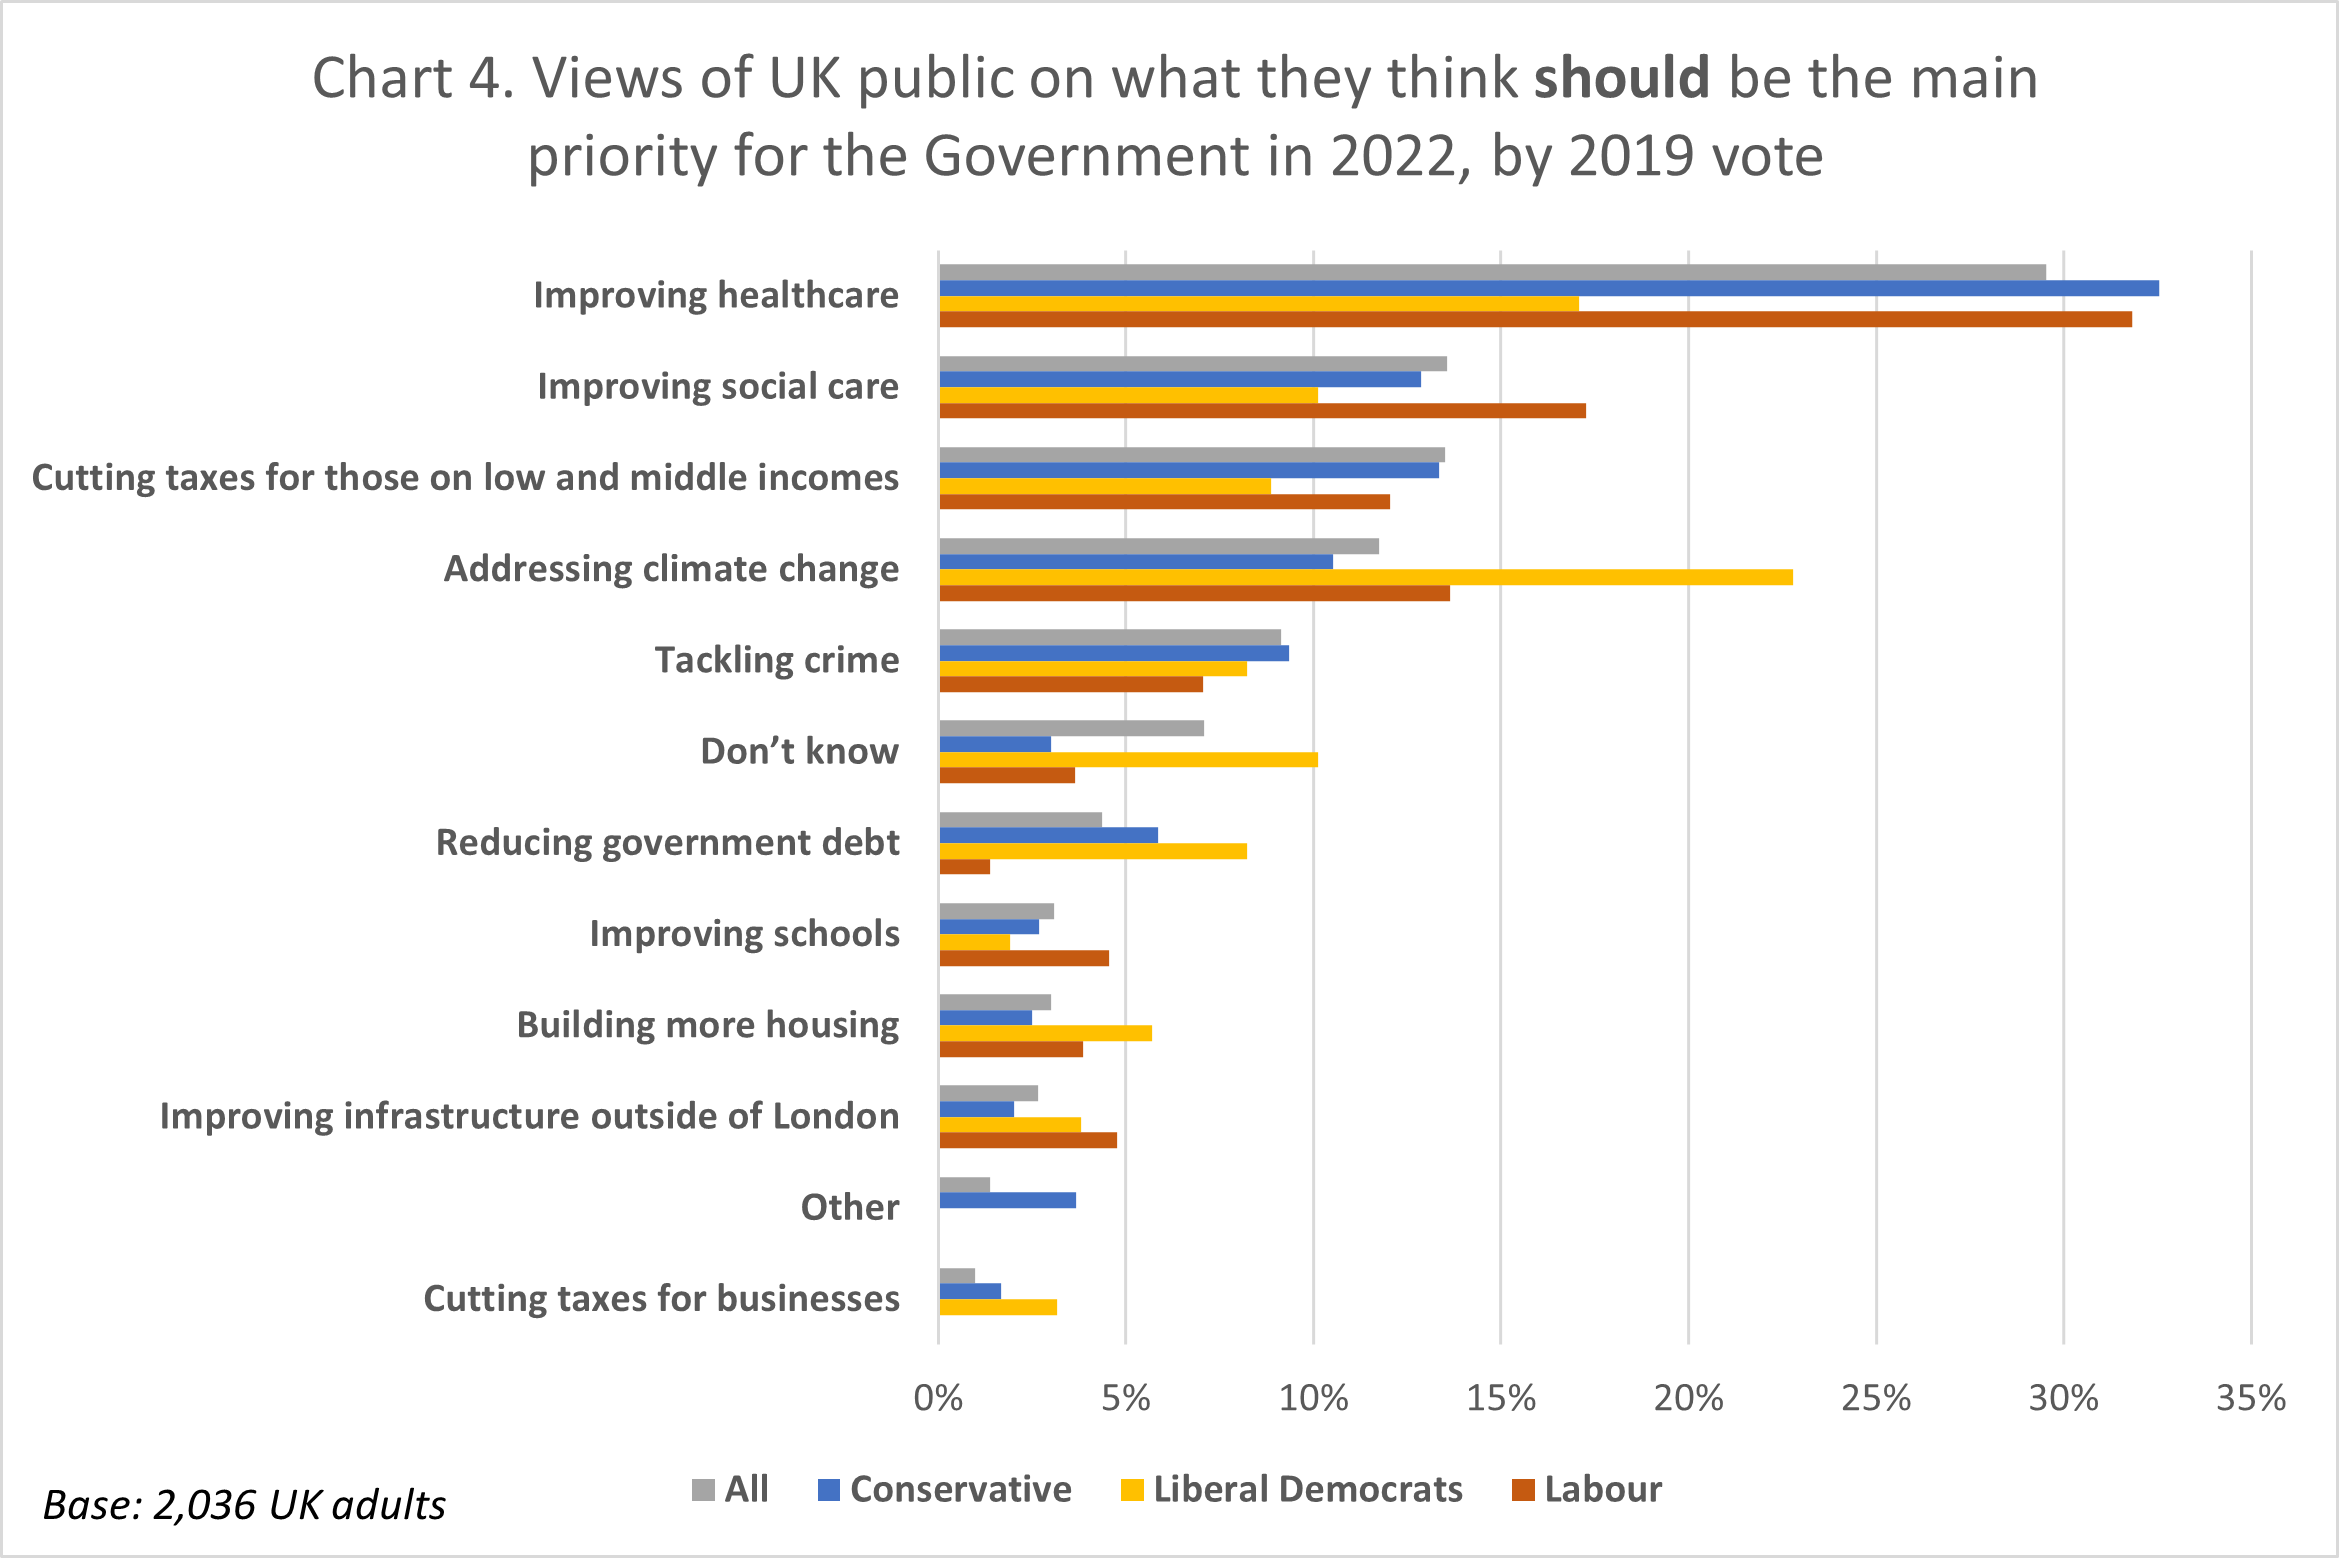
Improving healthcare emerges again as the top choice for the UK public as a whole (30%), and also for both 2019 Conservative voters (33%) and 2019 Labour voters (32%), with what should be the main priority for the current Government in 2022.
However, improving social care (14%) and cutting taxes for those on low and middle incomes (14%) comes in joint second place as what the UK public think the Government’s priorities should be. Similarly, 13% of 2019 Conservative voters select both of these choices in second and third place, while 2019 Labour voters chose improving social care (17%) and addressing climate change (14%) as what should be the main choice in second and third place.
Reducing government debt is seen as what should be the main priority for the Government by only 4% of the UK public, and only 6% of 2019 Conservative voters, indicating that public debt is still not a major focus for the public, and highlighting a significant mismatch in what people expect will be the main priority, as shown in Chart 4 further above, and what they think it should be.
Furthermore, both the UK public as a whole, and 2019 Conservative voters specifically, are more likely to think that a variety of government policy areas require more spending, despite mixed assessment on the effectiveness of current spending, as shown in Chart 5 below.
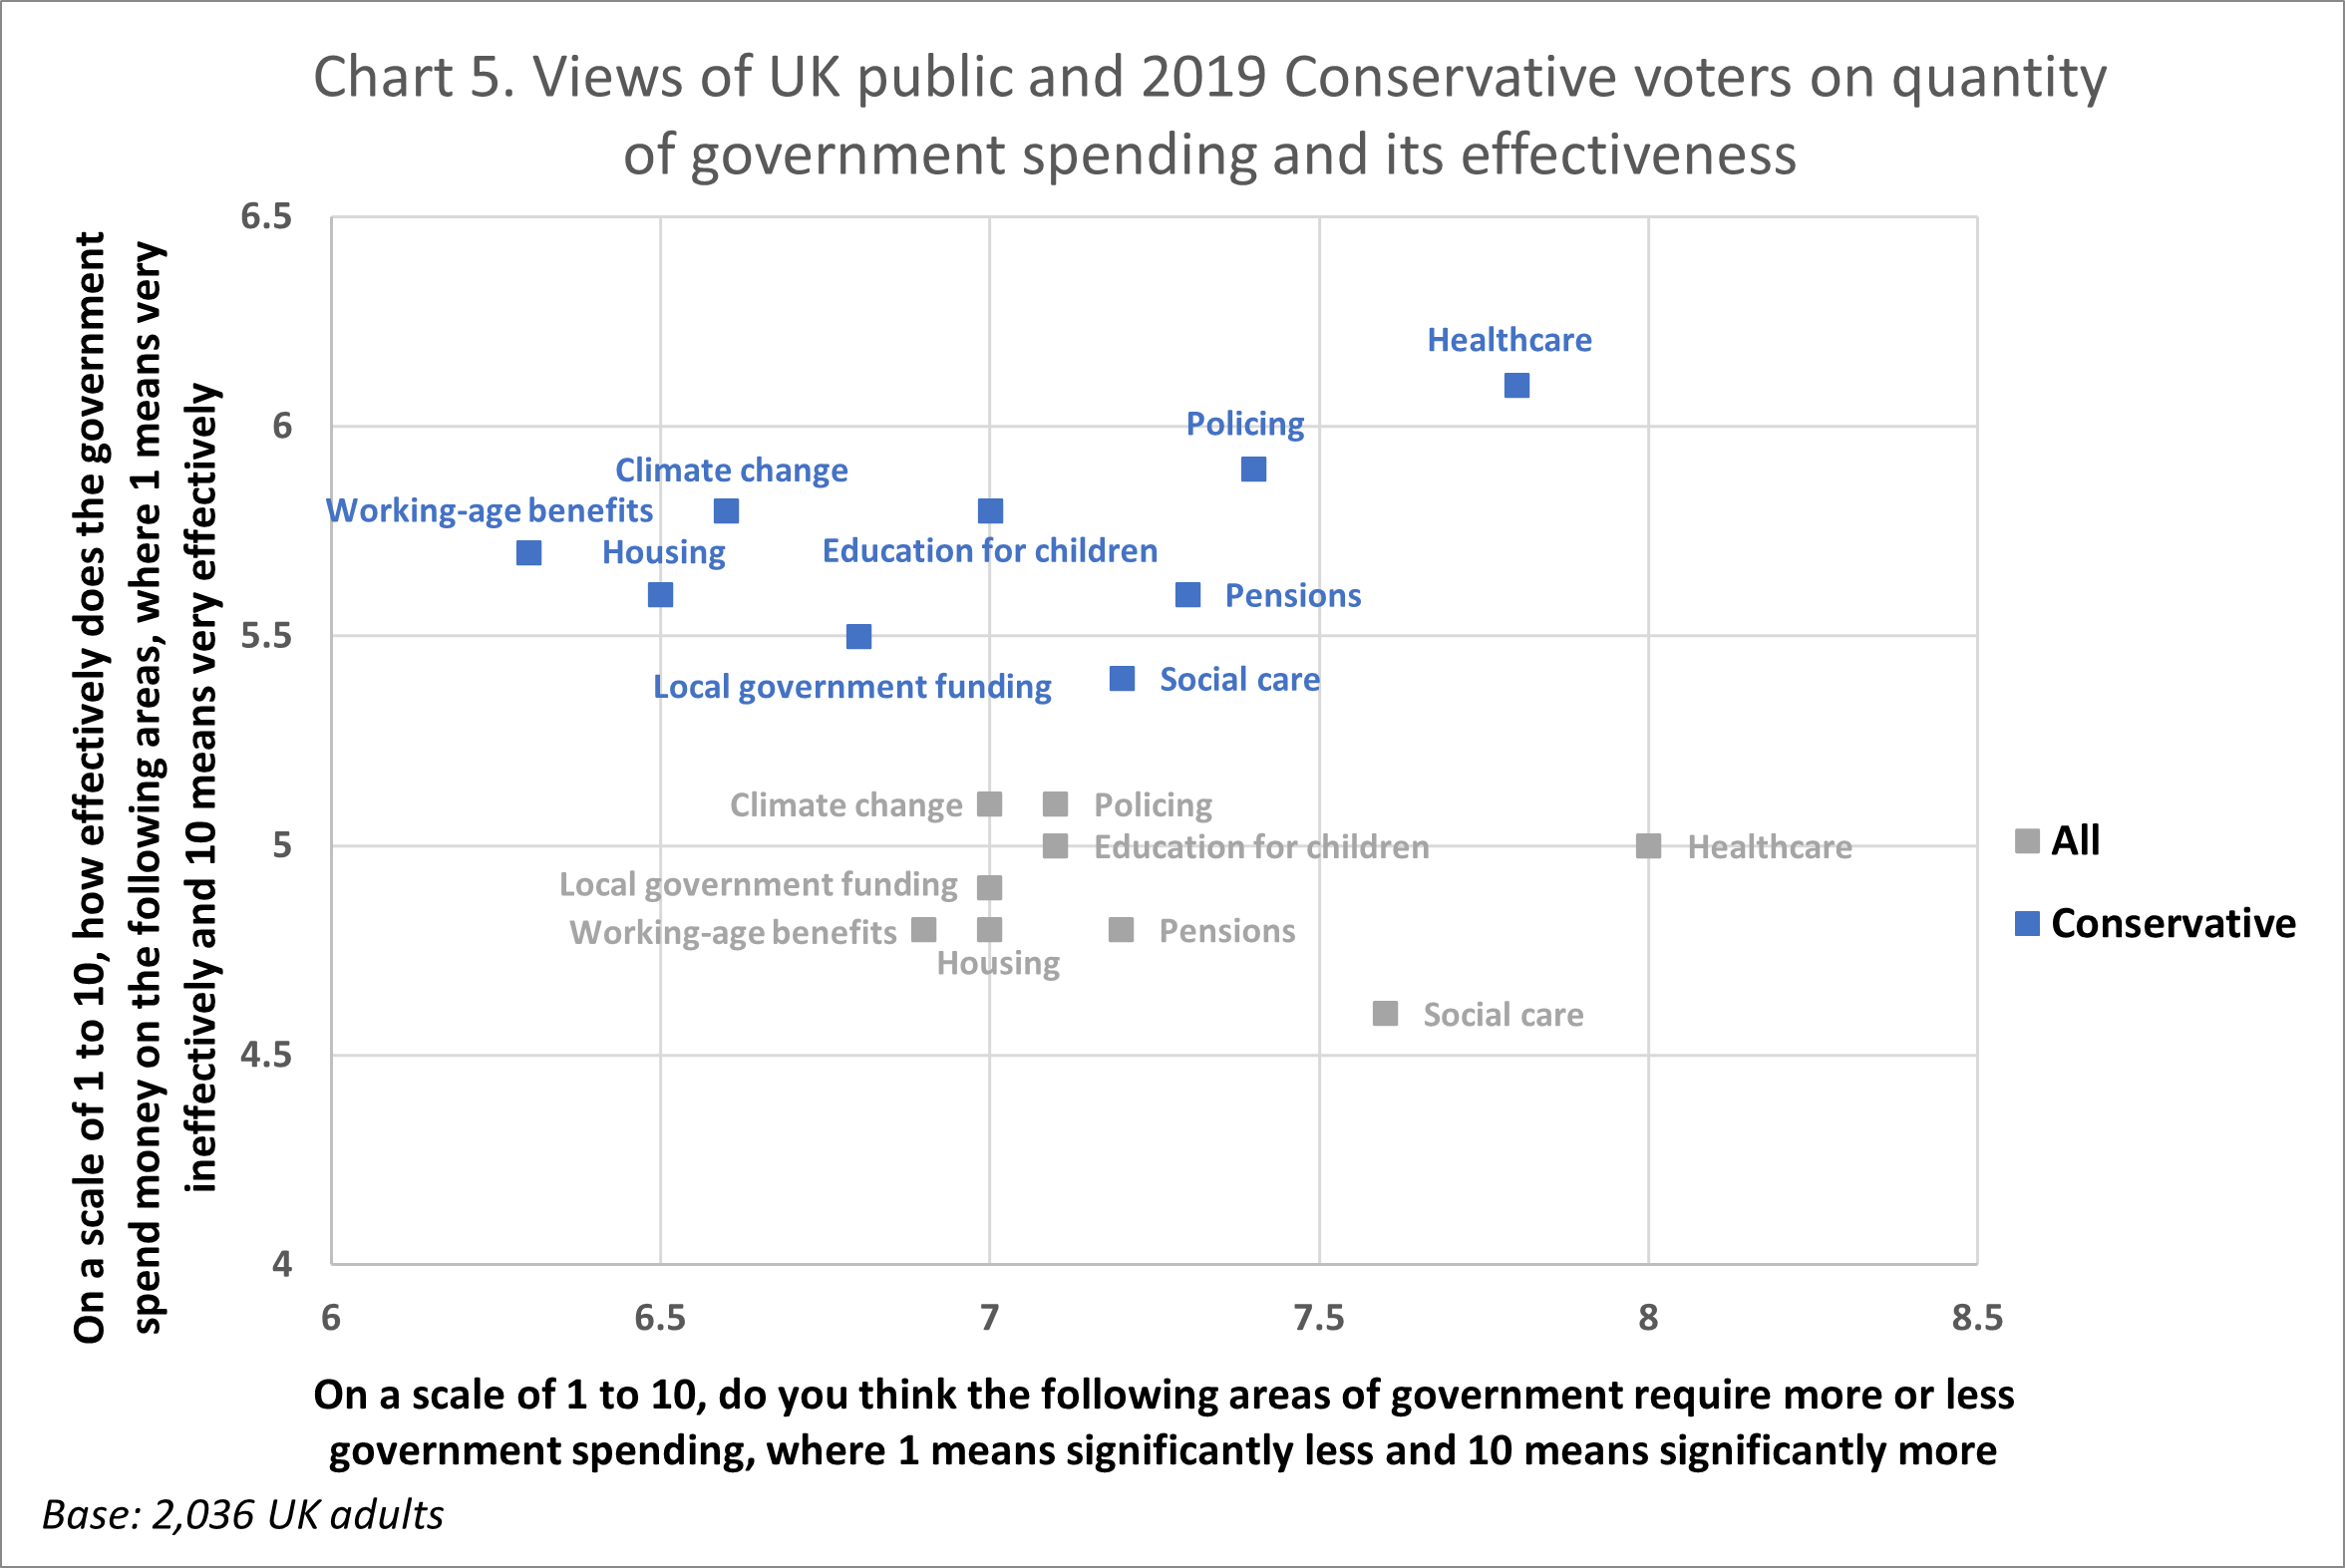 It is notable that the public as a whole, and 2019 Conservative voters, want to see more spending on average, with healthcare receiving the highest average score (8.0 and 7.8 out of 10 on average respectively), while working-age benefits received the lowest average score (6.9 and 6.3 on average respectively), but which is still indicative of greater support for more spending. While 2019 Conservative voters are slightly less likely than the public to be supportive of more spending on key government policy areas, they would still like to see more for all policy areas polled.
However, the UK public and the 2019 Conservative voters have a mixed view on the effectiveness of current spending on key government policy areas, with climate change and policing more likely to be judged as effective by the UK public (5.1 on average for both) and healthcare being more likely to be judged effective by 2019 Conservative voters (6.1). On the other hand, both the wider UK public and 2019 Conservative voters judge social care as the key policy area where spending has been the least effective (4.6 and 5.4 on average respectively). The UK public as a whole is slightly less likely than 2019 Conservative voters to judge spending on key government policy areas as effective.
Supporting people and businesses in 2022
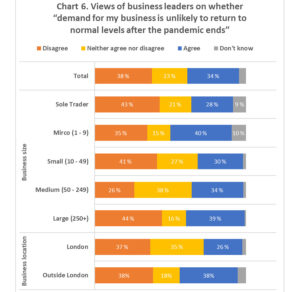
Views are divided on the best way the Government can support people on low and middle incomes in 2022, as shown in Chart 6 below.
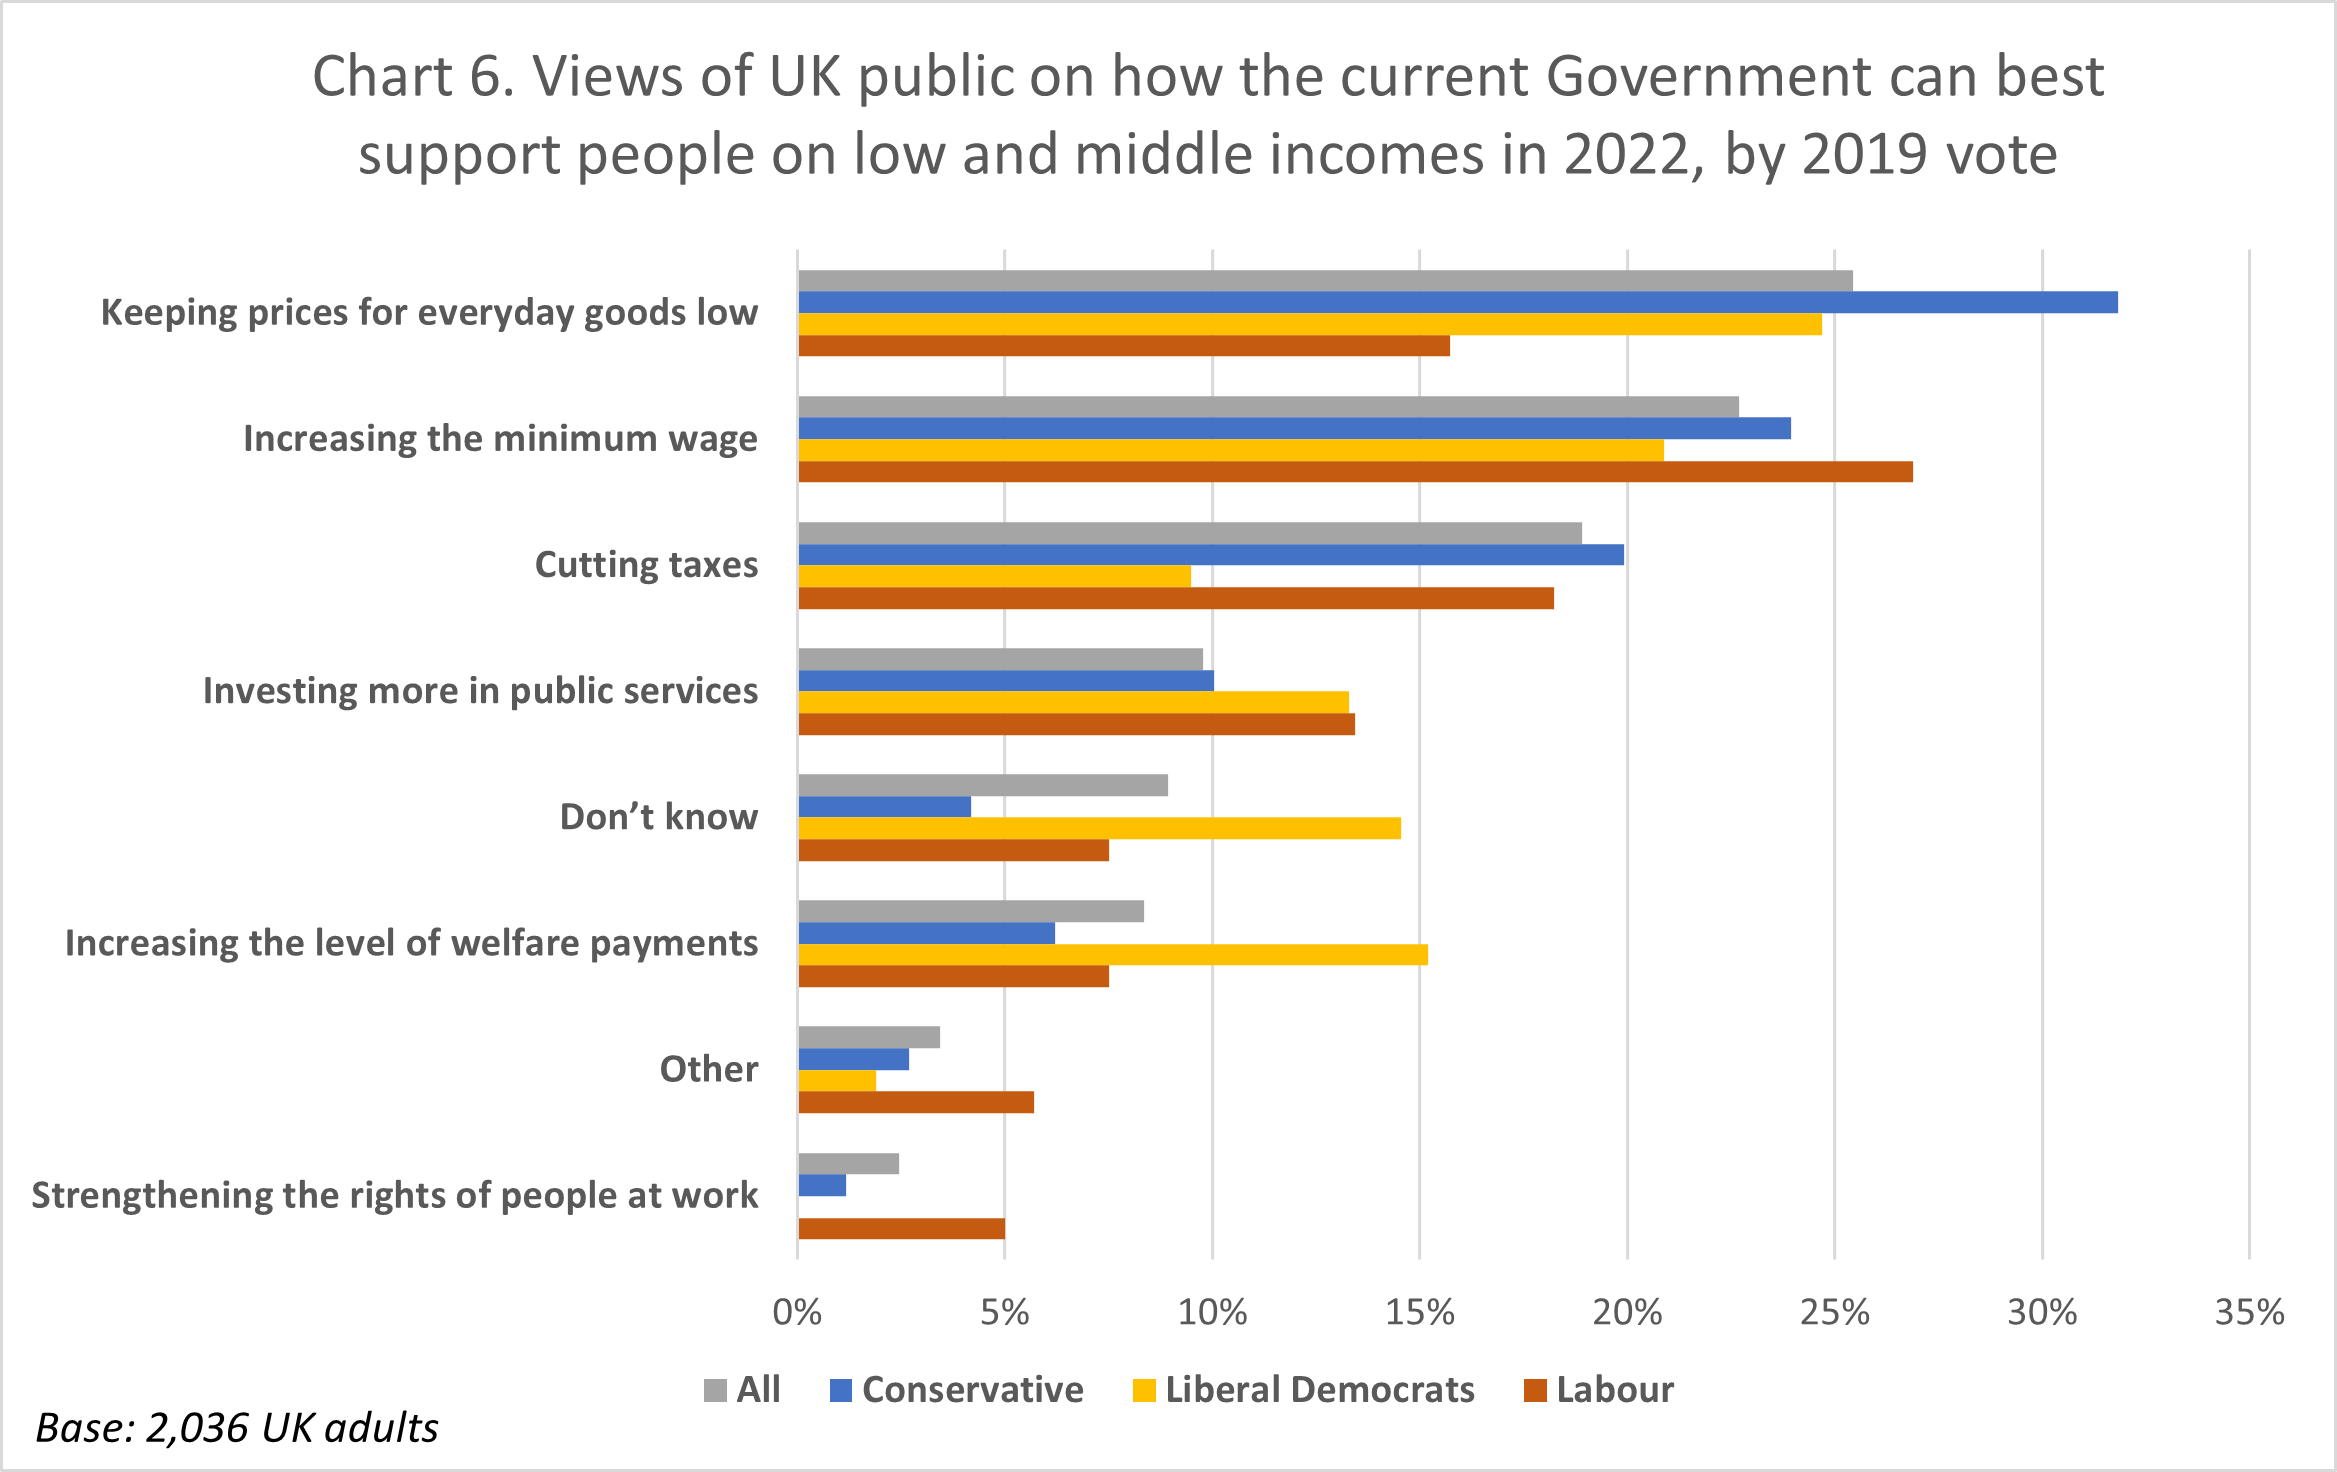 Keeping prices for everyday goods low (25%), increasing the minimum wage (23%) and cutting taxes (19%) are seen as the three best ways to help people on low and middle incomes by the UK public. The same ranking is given by 2019 Conservative voters, with keeping prices for everyday goods low (32%) coming first, followed by increasing the minimum wage (23%) and cutting taxes (19%). However, 2019 Labour voters are most likely to prioritise increasing the minimum wage (27%), followed by cutting taxes (18%) and keeping prices for everyday goods low (16%).
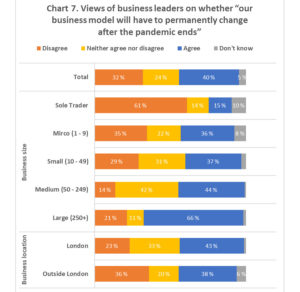
The UK public is similarly divided on the best way the Government can support businesses in 2022, as shown in Chart 7 below.
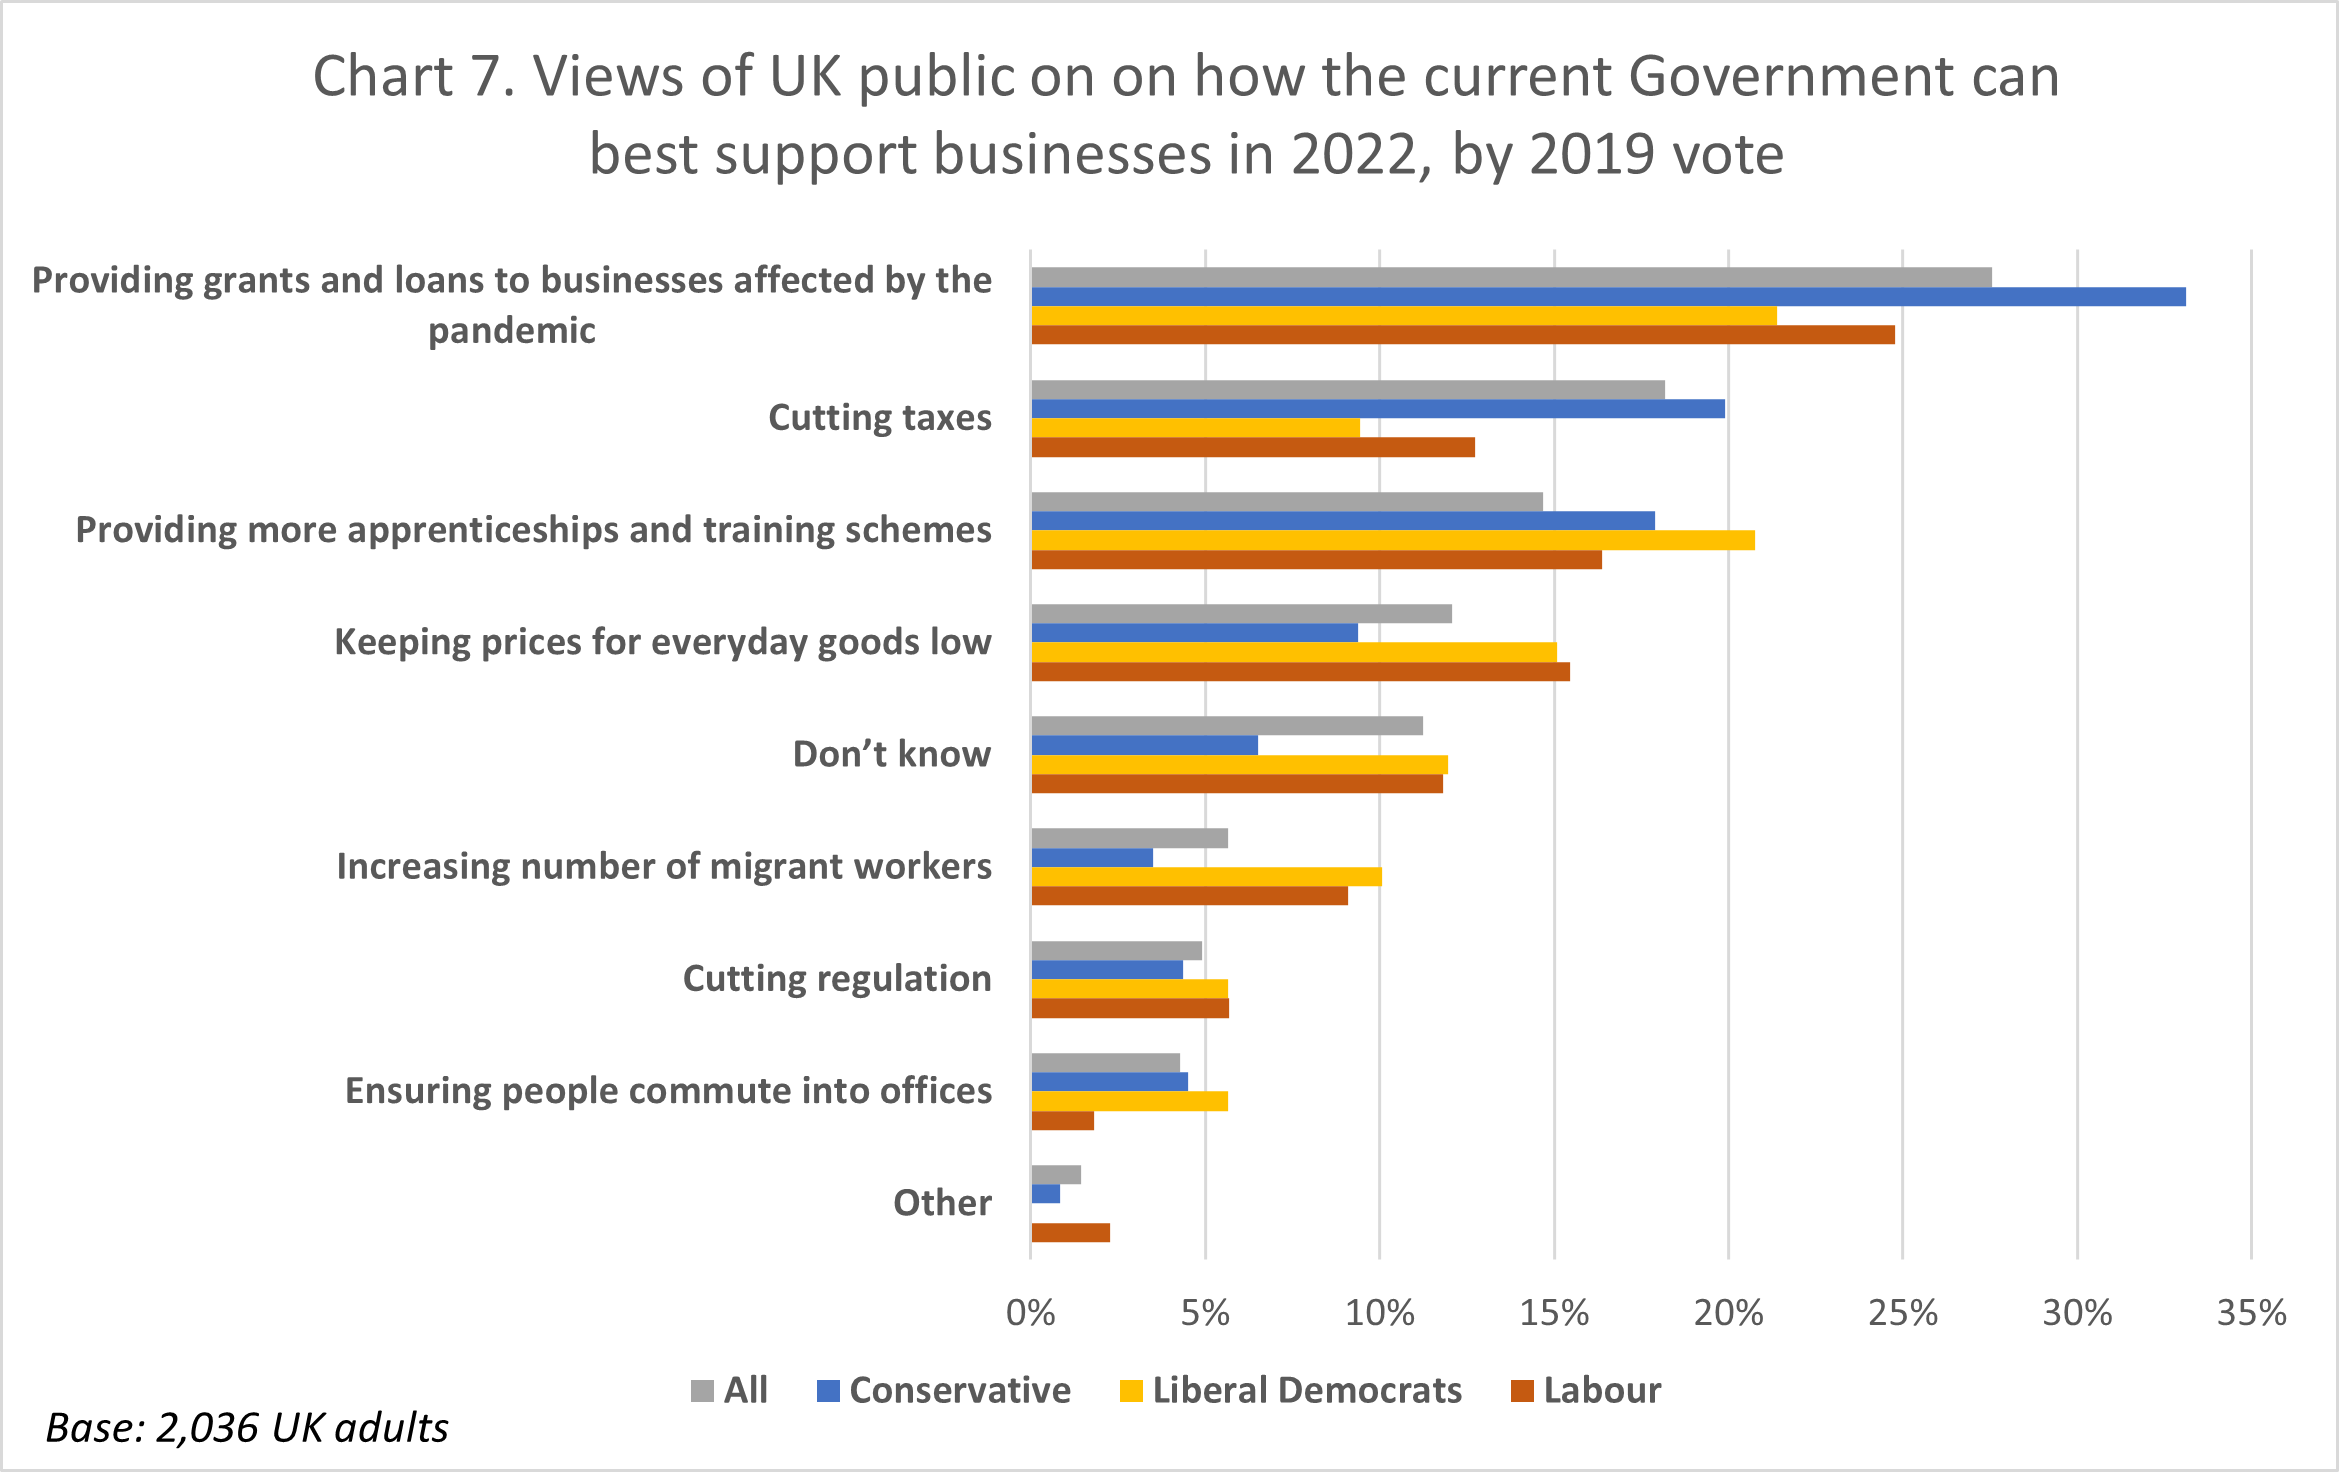 Among the UK public, providing grants and loans to businesses affected by the pandemic (28%), cutting taxes (18%) and providing more apprenticeships and training schemes (15%) are seen as the best three ways to support businesses in 2022. Both 2019 Conservative voters and 2019 Labour voters see providing grants and loans to businesses affected by the pandemic (33% and 25% respectively) as the best way to support businesses. However, while 2019 Conservative voters selected cutting taxes (20%) and providing more apprenticeships (18%) as the next best ways to support business, 2019 Labour voters selected providing more apprenticeships and training schemes (16%) and keeping prices for everyday goods low (15%).
Preparedness for major challenges in 2022
Thinking about the potential major challenges which the Government could face in 2022, the UK public thinks that they are unprepared to deal with them, as shown in Chart 8 below.
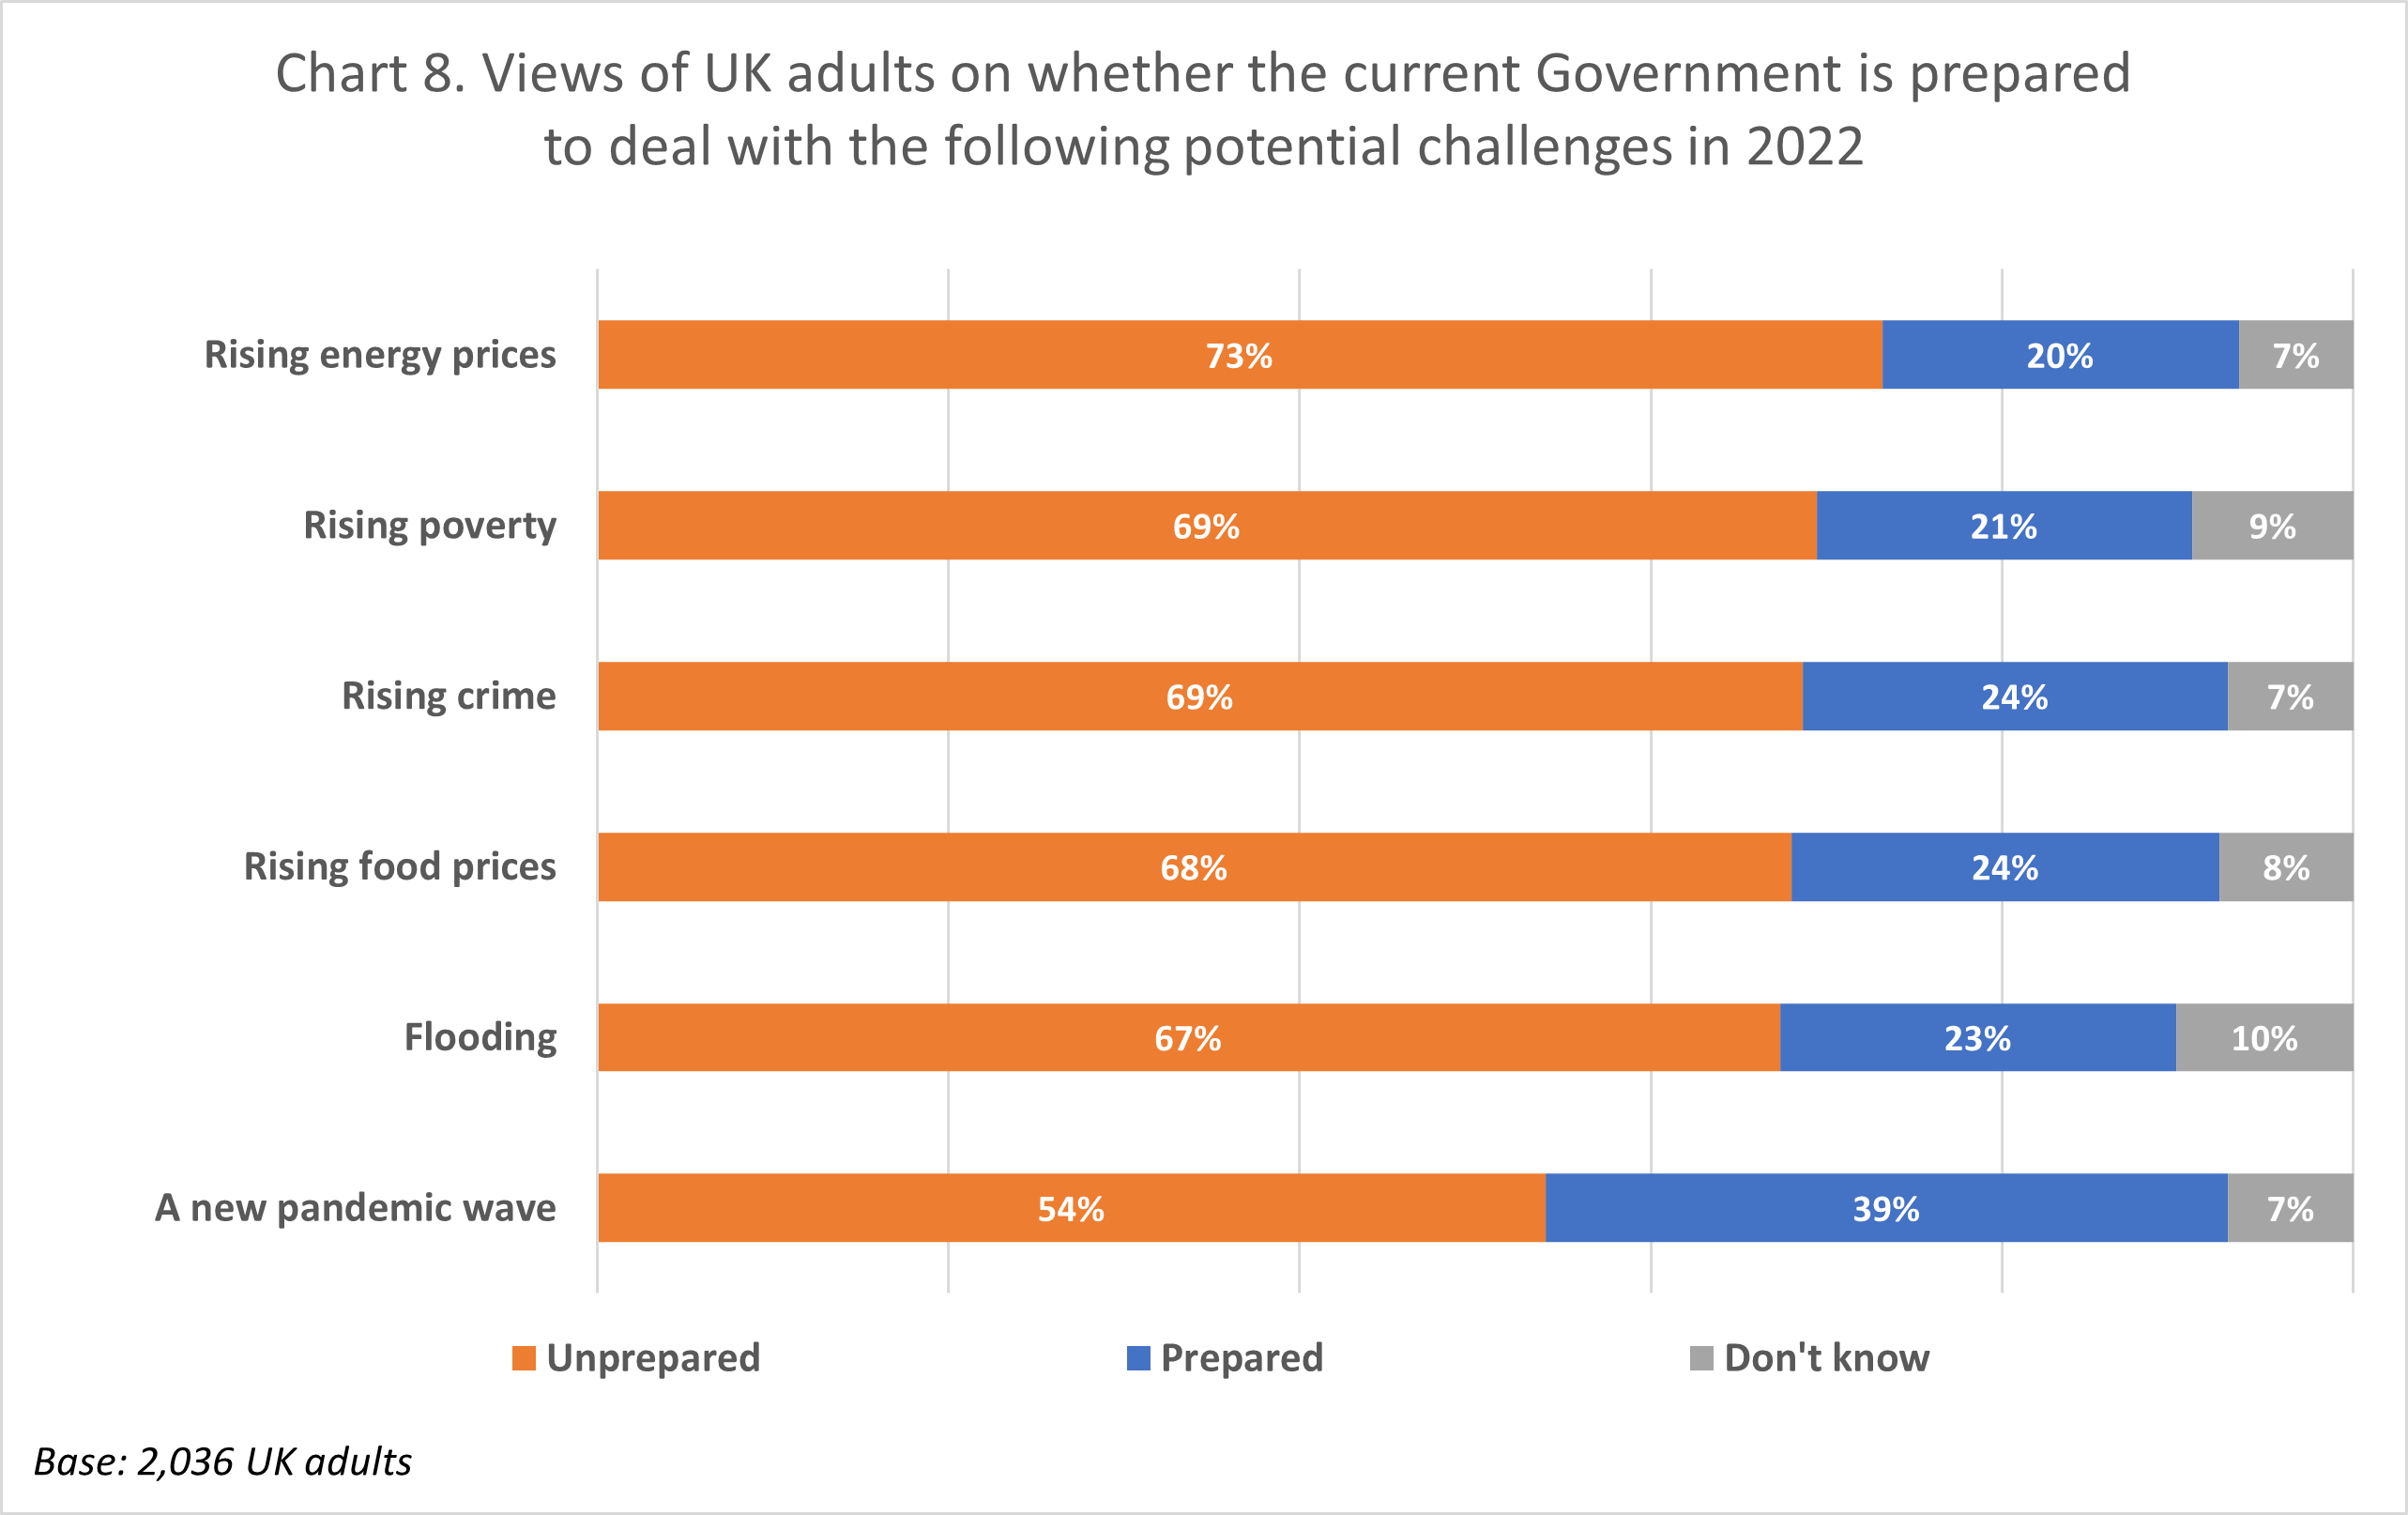 As illustrated in Chart 8, the majority of the UK public thinks the current Government is unprepared to deal with all of the polled potential major challenges, with 73% believing that they are unprepared to deal with rising energy prices, 69% believing that they are unprepared to deal with rising poverty, and 69% believing that they are unprepared to deal with rising crime. Even in terms of a new pandemic wave, only 39% believe that the current Government is prepared, while a majority of 54% believe they are unprepared.
Notably, 2019 Conservative voters also have a very pessimistic assessment of the current Government’s preparedness for potential major challenges in 2022, as shown in Chart 9 below.
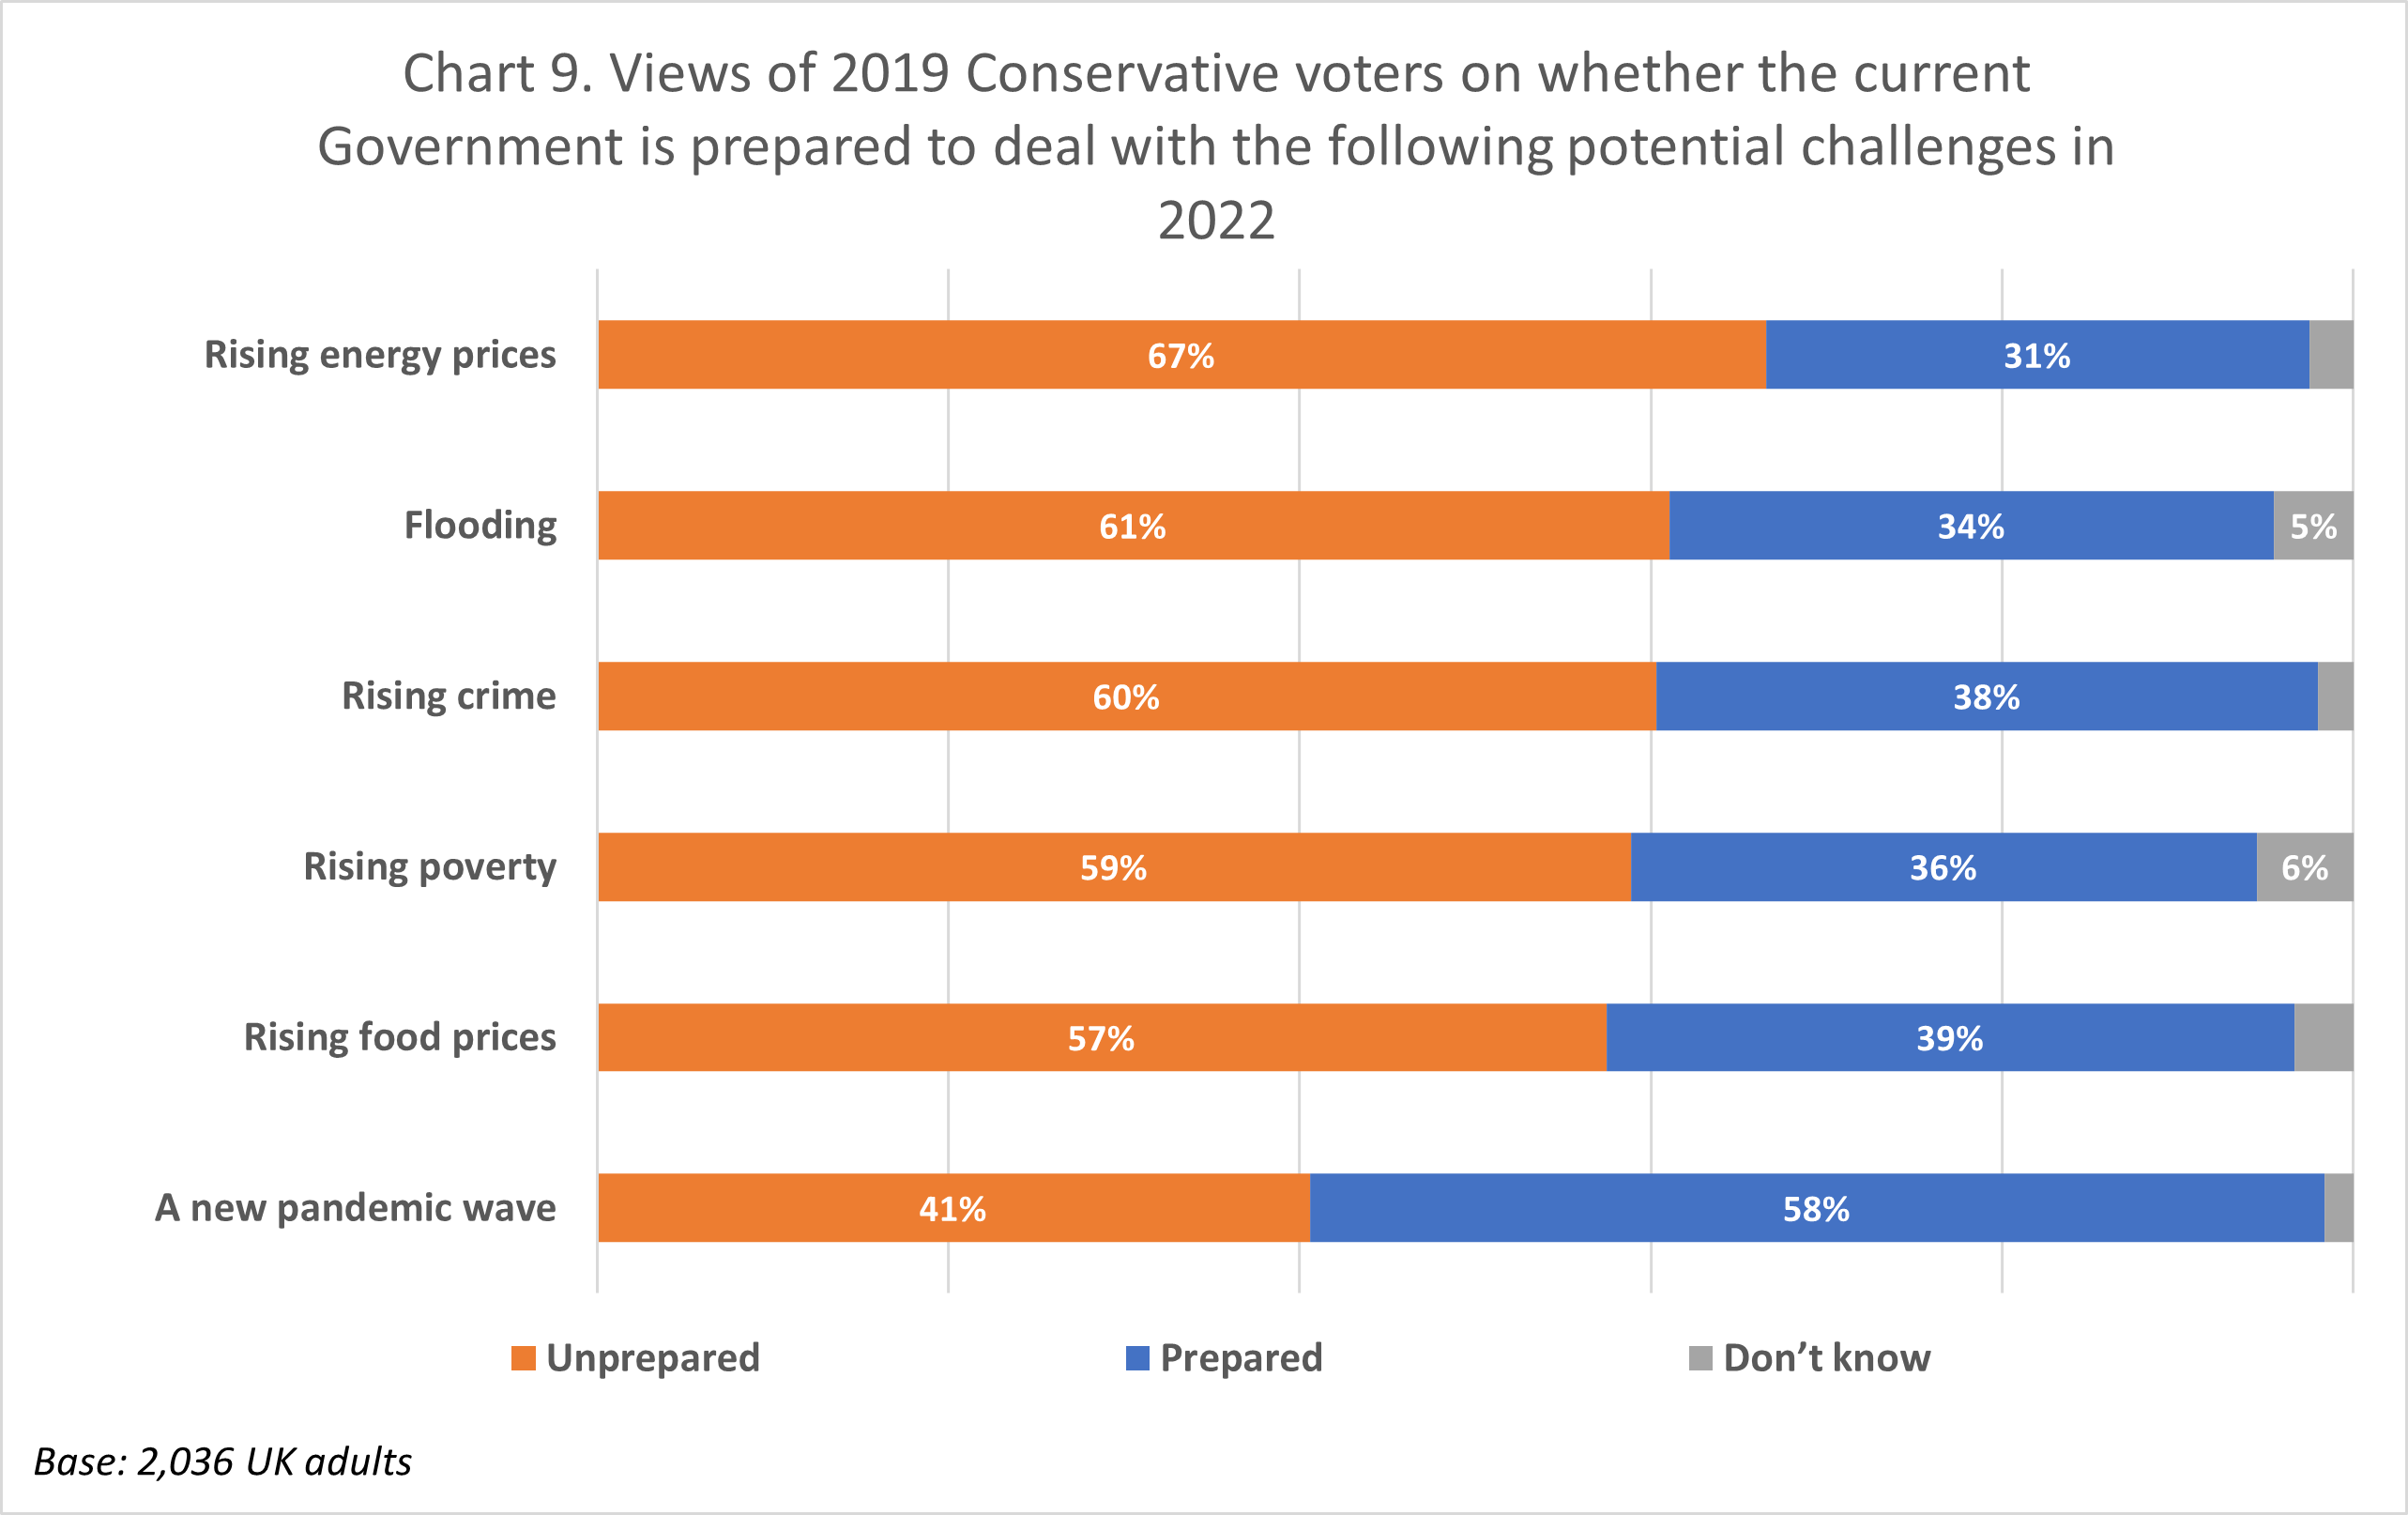 A majority of 2019 Conservative voters see the current Government as unprepared for all potential major challenges which we polled, with the exception of a new pandemic wave. Rising energy prices (67%), flooding (61%) and rising crime (60%) are the challenges which 2019 Conservative Voters believe to be as the most likely for which the current Government is unprepared. Nonetheless, a majority of 2019 Conservative voters (58%) do believe that the Government is prepared for a new pandemic wave in 2022.
Conclusion
This polling provides a snapshot of public opinion at this critical juncture for this Conservative Government, illustrating the overall negative perception of how the current Conservative Government has performed since 2019 and its preparedness for future challenges in 2022.
Damningly, the public as a whole, including 2019 Conservative voters, believe that on this Government’s watch, people in poverty and on low incomes have become financially worse off, despite the promise to ‘level up’ the country. In addition, the UK public also believe that the Government has performed worse than expected on dealing with issues across all major policy areas, and that it is unprepared to deal with rising prices, crime, flooding and poverty in the year ahead.
The UK public thinks that the best way to help struggling families is by keeping prices for everyday good low, raising the minimum wage and cutting taxes. They are most likely to report that improving healthcare will and should be the main priority for the current Government in 2022. Across all key government policy areas, the public believe the Government should spend more on them, but have mixed views on whether current spending is effective.
Overall, there is no denying the stark message from the UK public, and the 2019 Conservative voters, to the UK Government: step up and deliver.
Appendix
[Image: Dave Darshan]


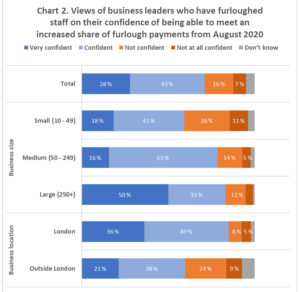
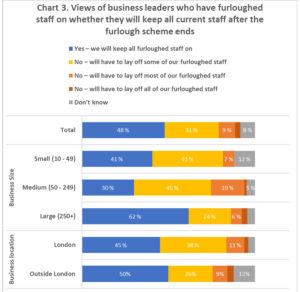
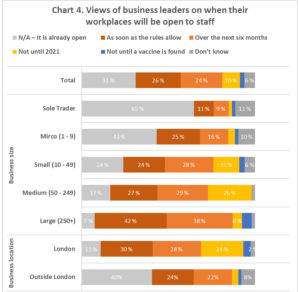
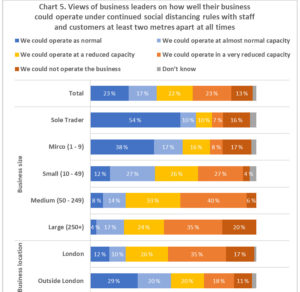
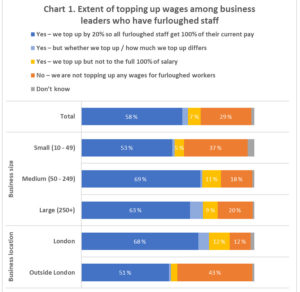 Base: 297 UK business leaders. Results for sole trader and micro business sizes are not shown due to small subsample size.