Category

BB Research

Anvar Sarygulov: Experiences and expectations of businesses during the COVID-19 pandemic

By Anvar Sarygulov, BB Research, Centre Write, Politics

The COVID-19 pandemic has generated a profound health and economic crisis in the UK.

More than nine million workers have been furloughed through the Coronavirus Job Retention Scheme (CJRS) for at least some time in the last three months, with the government paying 80% of their wages. Alongside this, there has been a raft of other grants, loans and funds available to businesses of all sizes to keep them afloat.

But economic recovery is likely to be a long and bumpy road. Businesses are likely to be negatively affected for some time by efforts to contain the pandemic and weak consumer demand.

Government currently plans to scale down CJRS over the coming months, and to end it fully by the end of October 2020. This will force businesses to make difficult decisions about their workforce.

We have partnered with Opinium to examine the experiences and expectations of businesses during the COVID-19 pandemic. In particular, we want to provide helpful insight into how businesses have operated and will operate after the pandemic.

Methodology

Polling was undertaken by Opinium and conducted between 18th and 24th June 2020. It consisted of a balanced sample of 520 business leaders in the UK across different sizes and sectors. To ensure robust sample sizes, quotas of at least 100 were applied to each business size; sole-traders, micro, small, medium, and large businesses.

Questions related to furlough were only asked of businesses which have furloughed at least some of their stuff through the Coronavirus Job Retention Scheme (CJRS). Out of our sample, 297 businesses have utilised the scheme.

In regards to business size, ‘micro’ refers to a business with one to nine employees, ‘small’ to those with 10 to 49 employees, ‘medium’ to those with 50 to 249 employees, and ‘large’ to those with more than 250 employees.

  1. Furlough

As seen in Chart 1 below, out of businesses which have utilised the furlough scheme, a majority (58%) have been topping up wages so that workers receive 100% of their current pay. In contrast, a significant minority (29%) have not been topping up wages at all. Importantly, of all business using the furlough scheme, 69% have topped up wages at least partly.

Medium (81%) and large businesses (79%) were far more likely to report topping up wages at least partly in comparison to small (59%) businesses. Although it should be noted that a majority of all types of businesses using the furlough scheme have topped up wages at least partly.

Similarly, London-based businesses were significantly more likely to be topping up wages (86%) at least partly than businesses outside of London (55%). But, again, across the country, most businesses using the furlough scheme have topped up wages at least partly.

Base: 297 UK business leaders. Results for sole trader and micro business sizes are not shown due to small subsample size.

From August, the Government expects businesses using the furlough scheme to start paying, gradually, a greater share of wages and pensions contributions for furloughed employees.

As seen in Chart 2 below, most businesses (71%) are confident or very confident that they will be able to pay an increased share of wages for furloughed employees.

However a notable minority of businesses are not or not at all confident (24%) that they will be able to meet an increasing part of the wages for furloughed employees, indicating that a sizeable number of businesses are likely to struggle with the gradual withdrawal of the CJRS.

Once again, medium (78%) and large (83%) businesses – and businesses operating in London (85%) – are more likely to express confidence that they can pay in increasing part the wages of furloughed employees in comparison to small businesses (59%) and those based outside of London (60%). Although, it should be highlighted that a majority of businesses of all sizes and across the UK are confident they will be able to pay an increasing share of the wages of furloughed employees.

Base: 297 UK business leaders. Results for sole trader and micro business sizes are not shown due to small subsample size.

Unemployment has been rising since Covid-19 came to the UK. But, with the withdrawal of the CJRS, there are fears of mass unemployment.

As seen in Chart 3 below, just under half of businesses (48%) expect to keep all furloughed staff on the payroll after CRJS ends. However, a considerable proportion (44%) of businesses do not expect to keep all of their current staff on payroll after the CJRS ends, with 31% of businesses expecting to lay off some furloughed staff, 9% expecting to lay off most of furloughed staff and 3% expecting to lay off all of furloughed staff.

There is significant contrast between medium and large businesses. Most large businesses (62%) are expecting to keep all of their furloughed staff on the payroll after the CJRS ends, while most medium businesses (65%) are expecting to lay off at least some people who are currently furloughed. The picture is more mixed for small businesses, with 47% expecting to lay off at least some furloughed staff, and 41% expecting to keep all of them.

Businesses in London are more likely to expect at least some lay offs of those who are currently furloughed (51%) than businesses outside of London (38%).

Base: 297 UK business leaders. Results for sole trader and micro business sizes are not shown due to small subsample size.

2. Operating during a pandemic

As seen in Chart 4 below, 31% of businesses have already opened up, or have stayed opened up, to staff to work from. Meanwhile, most businesses are planning to open their workplaces to staff to work from as soon as the rules allow (26%) or over the next six months (24%). Only a small number of businesses currently expect not to open to staff until 2021 (10%) or until a vaccine is found (3%).

While a majority of sole traders (65%) and a significant number of micro businesses (43%) are already open, the numbers are notably lower for small (24%), medium (17%) and large (7%) businesses.

Notably, businesses in London are far less likely to already be open (11%) compared to businesses elsewhere in the UK (40%). London businesses and are far more likely to expect to stay closed until 2021 (24% in comparison to 4% of non-London businesses).

Base: 520 UK business leaders

The Government has continued to relax social distancing rules as COVID-19 caseload has fallen. From July 4th 2020, most businesses will be able to reopen, provided they follow government guidelines on how to protect their employees and customers. Furthermore, the Government has relaxed the two metre rule to one metre where two metre distance is not viable, as long as other risk mitigation is implemented.

As seen in Chart 5 below, the vast majority of businesses (85%) report that they could operate to some extent under continued social distancing rules where staff and customers are at least two metres apart.  But only 23% of businesses could operate as normal. In contrast, 13% would not be able to operate at all. This suggests that the recent change in policy from two metres to one metre could be of significant help to a large number of businesses.

Sole traders (54%) and micro businesses (38%) are far more likely to be able to operate as normal even under stringent social distancing rules in comparison to small, medium and large businesses (12%, 8% and 4% respectively), with the majority requiring many or some adjustments while operating under a reduced capacity.

Businesses outside London are more likely to be able to operate as normal (29%) compared to those in London (12%). In contrast, a majority of businesses in London could either not operate at all (17%) or only in a very reduced capacity (35%) under stringent social distancing, whereas outside London this falls to 11% and 18% respectively.

Base: 520 UK business leaders.

3. Operating during a pandemic

Will businesses ever return to normal? We tested initial attitudes of business leaders.

As seen in Chart 6 below, when asked about whether demand is unlikely to return to normal levels after the pandemic ends, 34% agreed, 38% disagreed, 23% neither agreed or disagreed, and 5% said they didn’t know. This indicates there is a lot of uncertainty about demand for business in the long-term, even after the pandemic.

There are some minor variations on expectations of demand among businesses of different size. More notably, business leaders outside of London are more likely to have expectations that demand is unlikely to return to normal levels after the pandemic ends (38%) in comparison to London businesses (26%).

Base: 520 UK business leaders.

As seen in Chart 7 below, a significant number of business leaders (40%) agree that their business model will have to permanently change after the pandemic ends, while 32% disagreed. This means businesses are more likely to report than not that their business model will have to change permanently.

However, the majority of sole traders (61%) disagreed that their business model will change, while a majority of large businesses agreed (66%). Views among businesses of other sizes were more mixed, with micro and small businesses being more likely to disagree (35% and 29% respectively) compared to medium businesses (14%), as the latter was more likely to not hold an opinion in either direction.

While similar number of business leaders in London and outside of it agreed that business models will have to change (43% and 38% respectively), levels of disagreement were notably lower in London (23%) compared to outside of it (36%).

Base: 520 UK business leaders.

Conclusion

The Government’s furlough scheme is generous relative to support offered in other countries. Most businesses using it are managing to top-up the wages of their furloughed staff and expect to do so in the future as the conditions around using CJRS change.

But a significant number of businesses lacks confidence in paying more wages for their furloughed staff and expect to let go at least some furloughed employees. A significant increase in unemployment is highly likely.

The social distancing measures have helped to stop the pandemic from running out of control, and businesses will benefit from the recent relaxations in the two-metre rule. But the threat of a resurgence continues to trouble businesses, with business leaders more likely to believe that demand for their trade will not return to normal for some time and that their business model is likely to be permanently changed.

The Government has already implemented extraordinary measures to address the COVID-19 pandemic. In the months ahead, they will have to effectively follow-up on current policies, to both contain the economic fallout from the crisis and to build the road to the recovery.

Anvar Sarygulov is a senior researcher at Bright Blue


Notes:

The full data tables for the polling can be found here.

We are grateful to Opinium for advising on and carrying out the survey.

Patrick Hall: Delivering net zero

By BB Research, Centre Write, Energy & Environment, Patrick Hall

Today, Bright Blue launched our latest publication, Delivering net zero: Building Britain’s resilient recovery, in conjunction with our partners at WSP. This essay collection brings together nearly 40 leading chief executives, politicians, academics and thought leaders from across the private, public and third sectors to highlight policies and projects across different economic sectors that are supporting and could support the journey to net zero in a post-COVID era.

Back in our 2018 report, Hotting up, Bright Blue advocated for a legal net zero emissions target. We argued that there was a sound scientific, technological and political case for transitioning to a zero carbon economy by the middle of this century. Not only is deep decarbonisation an environmental necessity, we argued, but an economic opportunity.

Since then, the UK has committed itself to a target of net zero emissions by 2050, becoming the first major economy in the world to commit to such an ambitious target. 

We’ve come a long way; the UK has reduced its emissions by just over 40% since 1990, whilst our economy grew by 75% over this same time period, showing that the goals of environmental action and economic growth need not be in conflict. But we cannot afford to be complacent as we seek to substantially reduce our emissions over the course of the next 30 years. 

The Government has made a good start, phasing out the remaining coal-fired power stations, recently removing restrictions on new onshore wind energy development, ending gas heating in new homes, and driving the roll-out of more efficient boilers. 

However, much more needs to be done. In particular, this decade is crucial: the state and market both need to provide significantly more investment and incentives to facilitate deep decarbonisation. So far, the Government has met its first and second carbon budgets – which ensure it remains on track to achieving net zero 2050 – and is on track to outperform the third. But beyond this, the Government is – by its own measures – going to fall short of meeting the fourth and fifth carbon budgets on the basis of its policies and plans to date.

Currently, politicians and policymakers are rightly focussed on the immediate and tragic COVID-19 crisis. But discussions are beginning now about how we will emerge from this crisis; how we will build back better. In many ways, COVID-19 has been a crisis of resilience, and so too will it be with the impending climate crisis. Governments, businesses and communities need and will be expected to do more to mitigate and build resilience to disruptive crises, especially those that have been predicated for a long time. 

Whether it’s the roll out of a privately-backed Green Investment Bank, a new scorecard for HM Treasury setting out how each new policy aligns with net carbon emissions, a reformation of air passenger duty to incentivise the uptake of sustainable aviation fuels, or the removal of tariff and non-tariff barriers in low carbon sectors as part of Britain’s post-Brexit trading future, the ideas laid out in our essay collection are plentiful and unique. 

By breaking down this essay collection into different sections by sector, we present fresh thinking and new ideas from industry leaders, politicians and academics in transport; land; utilities; buildings; industry; waste; finance; government; and, innovation.

It is our hope that this essay collection will provide inspiration to politicians, policymakers and practitioners – especially in advance of COP26 – to implement innovative programmes and policies to ensure our market-based economy can meet our net zero commitments.  

Indeed, the transition towards net zero is often seen as a leftist policy, requiring vast amounts of government-led investment and intervention. Yet, this neglects the progress that has been made on decarbonisation to date and could further be made in the future through well-regulated markets with sensible incentives from Government. We believe this current Conservative Government urgently needs to encourage and promote market-based reforms to yield substantial economic and environmental benefits in the journey to net zero.  

Delivering net zero is a challenge, but it is also an opportunity. Creating a low carbon economy, and its associated jobs, means that just as the UK once was the birthplace of the industrial revolution, so too can it foster a new era of green growth. Once the immediate health crisis from COVID-19 reduces, there will be a need to lead Britain to a stronger and more resilient economy. Undoubtedly, green industries should play a leading role in this.  

The Government has signalled its determination to move towards a net zero economy, with the Prime Minister, the Rt Hon Boris Johnson, using his inaugural speech to mention that the UK will “no longer make any contribution whatsoever to the destruction of our precious planet brought about by carbon emissions”. Time to deliver on that promise. And quickly.

Patrick is a researcher at Bright Blue and is co-editor of Delivering Net Zero: Building Britain’s resilient recovery. 

Joseph Silke: Separate support?

By BB Research, Centre Write, Joseph Silke, Welfare

In the final days of the 2014 Scottish Independence referendum campaign, the three main unionist parties promised that new powers would be devolved from Westminster Holyrood in the event of a ‘No’ vote. ‘The Vow’ committed to making the Scottish Parliament ‘the most powerful devolved assembly in the world’. Following the rejection of separation at the ballot box, Prime Minister David Cameron established the Smith Commission to determine how to fulfil the promise of the transfer of powers. The Scotland Act 2016 delivered on the recommendations, including the transfer of a range of powers over social security. 

The legislation mandates the transfer of control over 11 benefits, with the Scottish Parliament able to make changes to their value, eligibility and scope. Collectively, this amounts to around £3.5 billion of yearly social security payments to be paid to roughly 1.4 million Scots. The transfer of their delivery from the British Department for Work and Pensions (DWP) to Social Security Scotland (SSS) is ongoing, and should be fully completed by 2024. 

Today, Bright Blue Scotland releases the first major report that looks into Scottish public attitudes towards social security since the post-referendum settlement: Separate support? Attitudes to social security in Scotland, addressing a major research gap. 

Drawing on public polling of the Scottish public conducted by Opinium, the report explores the broad attitudes of Scots on the purpose and effectiveness of the social security system, their views on specific reforms that have been or will be introduced by the Scottish Government and their support for a range of potential future reforms. The report also breaks down these views by social, economic and political divides.

It is important to note that the research was conducted prior to the outbreak of coronavirus; before the unprecedented expansion of the state to support the livelihoods of individuals during the pandemic. This research, therefore, acts as an indication of the baseline of public opinion pre-COVID-19. While it is impossible to know at this stage what the long term consequences of coronavirus will be for the relationship between the state and individuals, it is clear that the economic disruption means that more people are now reliant on the state for social security than at any point in living memory. 

Purpose and effectiveness of social security

The research has found that a clear majority of Scots (70%) believe there is quite a lot of real poverty in Scotland, with 62% believing that poverty has gotten worse over the past decade and almost half (47%) believing that the problem will continue to get worse over the next decade. It is unsurprising, therefore, that 64% of Scots believe further cuts to social security would be damaging and more Scots are likely to want spending to be increased rather than decreased, although there is division over how such increases should be funded. 

Devolution of social security

Devolution of social security is generally popular, with 60% of Scots overall and even 43% of ‘No’ voters wanting the Scottish Parliament to decide most or all of Scotland’s social security policy, although this is supported by only 29% of Conservative voters. Awareness among the Scottish public of the benefits that are being devolved is low, however, with a majority of Scots unable to correctly identify what has been devolved. 

There is notable support for social security principles commonly associated with centre-right: that social security should promote personal responsibility (72%); that social security should only be a safety net (59%); that social security should be conditional on strict requirements (58%); and that those who have paid income tax and NI for a greater number of years should receive greater help (64%). 

A majority of Scots also supported the principles introduced by the Scottish Government, including that social security is a public service (65%), that it is a human right (57%), and that it should be actively promoted to those who are eligible (61%).

Universal Credit

Most Scots support the presence of conditionality (71%) and sanctioning (52%) for unemployed Universal Credit claimants and some support for conditionality and sanctioning for other claimant groups, such as parents of young children (38%), the self-employed (40%), and part-time, low-income working people (37%). Labour and SNP voters tended to be divided on conditionality and sanctioning measures for different claimant groups, while Conservative voters tended to support them. 

Most Scots support the flexibility of Scottish Choices for Universal Credit in terms of frequency of payments (62%) and the ability to have their housing element paid directly to their landlord (74%). A majority (62%) would also like the claimants to have the ability to split their payment across different members of the household, which has been promised by the Scottish Government, but yet to be delivered.

Devolved benefits

There is significant support for devolved benefits for those on low income, including for fuel (79%), funeral (71%) and council tax costs (73%). There is plurality support for the expansion of grants offered to low-income parents of young children through the Best Start scheme and most Scots support introducing the Scottish Child Payment. 

Scots also support the Scottish Government’s reforms to reduce face-to-face assessments for disability benefits with 47% of Scots believing the current application process is too demanding. However, Scots are agnostic about who carries out the assessment service, with more Scots (45%) believing that it does not matter whether a public or a private company is involved.

Improving social security

Bright Blue Scotland has found majority support for the following further, alternative reforms:

  • Bright Blue Scotland’s idea of an additional income supplement for those on low incomes based on previous National Insurance contributions (59%)
  • Bright Blue Scotland’s idea of an establishment of an independent compensation scheme for benefit claimants that have been failed by the DWP, such as on timeliness of benefit payment (57%)
  • A compulsory employment support scheme for people with disabilities who are able to work (55%)
  • Government-funded incentives to employers for offering work to long-term unemployed (63%)
  • Attracting the highest level of support, allowing carers to keep more of their Carers Allowance depending on their earnings (65%)

Finally, many Scots (45%) are open to the idea of introducing a universal basic income (UBI). The idea, which has been touted on radical fringes for generations, has been discussed more widely in the context of coronavirus. Amongst the funding options proposed for UBI, however, there was a marked lack of consensus, with higher income taxes on those who earn more than £50,000 (21%) and a new tax on wealth (20%) being the most popular choices. 

The report demonstrates that the social security principles and reforms of the Scottish Government, prior to the COVID-19 crisis, were broadly in line with Scottish public attitudes. However, there is also public support for constructing the social security system based on a range of principles, including those associated with the centre-right, and for alternative reforms to the Scottish social security system. With elections for the Scottish Parliament coming up next year, this research provides a critical insight into the attitudes of the Scottish people, made all the more timely by the increased prominence of social security issues due to the coronavirus pandemic.

Joseph Silke is Research and Communications Assistant at Bright Blue. 

Helen Jackson: High and dry?: Preventing tomorrow’s “flood ghettos”

By BB Research, Centre Write, Helen Jackson

Introduction

The severe flooding of last November and December, as well as recent Storms Ciara and Dennis, have brought renewed focus on whether the Government is doing enough to protect and support high flood risk communities, both before and after flood events. For some hard hit places, for example in the Doncaster area, it has been the second or third major flood event they have experienced in two decades.

The UK needs to become a climate ready nation. We know that flooding is going to get worse with climate change. This means not only that we develop foresight on physical impacts and effective adaptation policies at a technical level, but also that we understand the human impact. Supporting flood-hit communities, rather than leaving them to shoulder crippling financial impacts alone, is a clear test of whether we can respond to climate change as a decent society.

This needs to be viewed not just as a matter of individual tough luck. It is all too easy to foresee scenarios where high-risk communities experience repeat flooding, the flood component of home insurance becomes prohibitively expensive or unavailable for growing numbers of properties, and this has knock-on effects for the entire community and local economy. These impacts could include small businesses being deterred by lack of insurance cover; the cost of uninsured losses hitting spending power on local goods and services; and rows of blighted houses which cannot be mortgaged or sold on —what one commentator has called “flood ghettos” [i].


Government policy

There are major concerns over the cost and availability of flood insurance; the effectiveness of defences and land management; and, what can feel to some householders like arbitrary rules on who is entitled to flood recovery grants, financial support provided by government to households, businesses and communities affected by flooding [ii]. Indeed, shortly after the late 2019 floods, the then Environment Secretary announced a review of flood insurance to investigate why some at-risk householders are still apparently unable to insure their homes despite the existence of a government and industry scheme (Flood Re) designed to help them.

Admittedly, policymakers recognised concerns over flood insurance many years ago. Flood Re was set up by the Government and the insurance industry to make flood insurance affordable for households in high risk areas, and has been running since 2016. Insurers can pass the flood risk element of household insurance to Flood Re for a fixed price, lowering household premiums and excesses. Some insurers directly pass the cost of the scheme onto all policyholders, and at its instigation it was estimated that the cost to an individual policyholder would be equivalent to an increase of £10.50 per policy [iii]. The scheme is due to be phased out in 2039 at which time all flood insurance will be ‘risk-reflective’.

Any scheme which spreads risk from those who can do most to reduce it to other parties inevitably raises the issue of moral hazard – the idea that transferring the cost of risky behaviour reduces the incentive to avoid it. To tackle moral hazard, Flood Re was limited to only covering properties built before 1st January 2009 (referred to below as ‘post-2008 properties’).

Disincentives to increase flood risk are a good public policy goal. However, in their 2019 progress report on UK climate adaptation, the Committee on Climate Change said: “We have no evidence (and are aware of none being collected) to indicate that this [2009 cut-off point] has influenced where developers try to locate new developments” [iv]. This raises questions over whether it is actually affecting behaviour.

There is no legal requirement to provide flood risk information to homebuyers, although the Law Society publishes guidance on good practice in informing clients of flood risk during conveyancing.

We should consider that the 2009 cut-off, rather than reducing exposure, may have simply left unwary homebuyers, to use an inappropriate expression, ‘high and dry’. As they are not covered by Flood Re, concentrations of post-2008 properties in high flood risk areas, such as new estates, are naturally some of the most vulnerable in the country to becoming ‘insurance blackspots’.

It is worth assessing how widespread this problem might be, and which parts of the country might be most affected.


Identifying ‘at-risk’ properties

The number and locations of post-2008 properties in areas at risk of flooding in England can be estimated using Land Registry data on property transactions alongside Environment Agency geospatial flood risk data products.

As Land Registry data provides the postcode of each transaction, and states whether properties are new builds, it can be estimated how many post-2008 properties have been constructed in various flood zones in each postcode and local authority district. See the Annex for more detail on the methodology for this data analysis.

The scope of the data analysis is:

  • England only (due to time constraints, given that UK flood maps are compiled by four different agencies, and property transaction data by three)
  • Residential (not commercial) properties
  • Risk of flooding from rivers and the sea only, not from surface water, groundwater or reservoirs

First, it’s helpful to summarise the various flood risk categories the Environment Agency, government and local authorities use. These are illustrated in Table 1 below.

Table 1. Categories of flood risk used in planning policy and public information

Flood risk zone or category Definition Takes defences into account? Examined in this analysis
Flood Map for Planning Risk[v] zones
Flood Zone 1 less than 0.1% annual probability of river or sea flooding No No
Flood Zone 2 0.1-1% annual probability of river flooding OR
0.1-0.5% annual probability of sea flooding
No
Flood Zone 3 greater than 1% annual probability of river flooding OR
greater than 0.5% annual probability of sea flooding
Yes
Flood Zone 3, benefitting from defences As above, but benefitting from defences Presence, yes; probability, no Used to identify properties in Zone 3 not benefitting from defences
Long term flood risk information[vi] categories
Very low risk less than 0.1% annual probability of river or sea flooding Yes, probability calculation takes defences into account No
Low risk 0.1-1% annual probability of river or sea flooding No
Medium risk 1-3.33% annual probability of river or sea flooding No
High risk greater than 3.33% annual probability of river or sea flooding Yes

Flood Zones 1, 2 and 3 are used in planning policy, and the probability of flooding described is the natural level in the absence of defences (i.e. unmitigated).

Planning policy defines land at risk of fluvial and coastal flooding to be mostly that in Zones 2 and 3.

In addition, four flood risk categories ranging from ‘very low’ to ‘high’ are used in the Long term flood risk information service, as detailed in the second part of Table 1. This is designed to inform householders of their flood risk, in terms of background (rather than imminent) and actual (rather than unmitigated) flood risk. Even in defended areas, flood defences “reduce but do not completely stop the chance of flooding as they can be overtopped, or fail” [vii].

For simplification, this analysis examines properties in just three categories of at-risk postcodes, defined here as follows:

  • Category A: postcodes in Flood Zone 3, defended or undefended
  • Category B: postcodes in Flood Zone 3 which are not in an area benefitting from defences
  • Category C: postcodes where at least half of all residential properties are at high risk of flooding (>3.33% annual probability), regardless of defences

These categories are not mutually exclusive. Category A includes all the properties in Category B and the majority in Category C. Category C are the greatest at-risk properties.


Concentrations of at-risk post-2008 properties in England

Land Registry data suggests around 70,000 post-2008 residential properties are in Flood Zone 3 in England (Category A, as defined above), although compared to official Government statistics, this is an underestimate, as the Annex explains in further detail. These 70,000 properties are at risk of becoming uninsurable due to their ineligibility for Flood Re.

Figure 1 below shows the locations of these at-risk post-2008 residential properties, with each circle representing a postcode, and the size of the circle reflecting the number of properties (to a logarithmic scale).

Figure 1: Postcodes in England in Flood Zone 3 (Category A) with post-2008 residential properties not covered by Flood Re

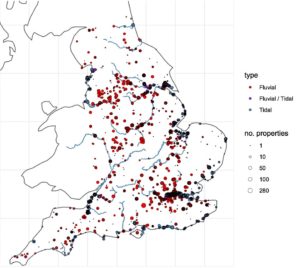
As Figure 1 indicates, a majority (52%) of these at-risk properties are in Greater London; however, an overwhelming majority (93%) of these London properties are in areas benefitting from defences, in particular the Thames Barrier.

Other obvious clusters include Humberside and the Yorkshire part of the Humber river basin (the Rivers Aire, Ouse and Don), Somerset, Lincolnshire and Fens, Thames Estuary, the Trent and Soar in the Midlands, Mersey and Greater Manchester, and the Lancashire coast.

Perhaps a stronger indicator of vulnerability to becoming uninsurable is the number of post-2008 properties which have been built in undefended areas (Category B), estimated at around 20,000.

Figure 2 below repeats the map shown in Figure 1, but removes Flood Zone 3 postcodes which benefit from defences. Thus, it illustrates the location of Category B at-risk postcodes – those in Flood Zone 3 without defences.

Figure 2: Postcodes in England in Flood Zone 3 with post-2008 residential properties not covered by Flood Re and not benefitting from flood defences (Category B)

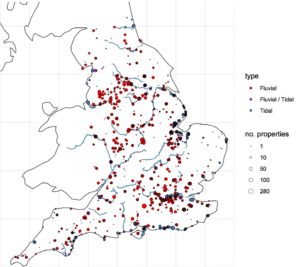
Much of London, Kingston upon Hull, Somerset and the Lancashire coast no longer show up strongly, but other clusters are left intact. Specifically, some of the greatest concentrations of at-risk post-2008 properties without defences include:  Boston and Spalding in Lincolnshire; parts of central Leeds, Bristol, York, Shrewsbury and Chelmsford; Mexborough near Doncaster; the Leicester urban area; the Sussex coast; Tonbridge in Kent; King’s Lynn in Norfolk; and certain London boroughs with a risk of flooding from River Thames tributaries rather than the River Thames itself.

Four further points of interpretation of the analysis so far should be noted.

First, remember these locations are flagged as vulnerable not because their flood risk is necessarily higher than other undefended Zone 3 locations, but purely because of the concentration of properties ineligible for insurance via Flood Re, since a higher proportion of them were built after 2008. We call these areas potential ‘insurance blackspots.’

Second, flood risk can be highly postcode-specific and just because a town contains a few streets at risk of uninsurability, that does not mean the whole town is a potential insurance blackspot.

Third, remember we are not mapping which properties are currently uninsured or uninsurable, but flagging vulnerability to this eventuality, although it is possible some of the postcodes flagged may already be experiencing it.

Fourth, simply pinpointing the location of these properties does not say anything about how well local flood risk assessments or design have dealt with the risk.


Top 10 local authorities with the most at-risk properties

We can now illustrate the local authorities that have the most residential properties in each Category, by both number and property value.

By number of residential properties

Table 2 below presents the top ten local authority districts (LADs) with the greatest number of post-2008 properties in Flood Zone 3, both as a whole (Category A) and undefended (Category B), including and excluding London.

Table 2. Local authority districts with the greatest number of post-2008 properties in Flood Zone 3, both as a whole (A) and undefended (B), including and excluding London

A: no. post-2008 residential properties in Flood Zone 3 B: no. post-2008 residential properties in Flood Zone 3, undefended
incl. London excl. London incl. London excl. London
local authority no. local authority no. local authority no. local authority no.
Tower Hamlets 6761 Kingston upon Hull 3212 South Holland 1158 South Holland 1158
Southwark 6286 North Somerset 2064 Boston 982 Boston 982
Wandsworth 5314 Sedgemoor 1759 Leeds 616 Leeds 616
Newham 4511 Dartford 1205 Newham 585 Bristol, City of 443
Greenwich 3319 South Holland 1158 Wandsworth 469 Doncaster 442
Kingston upon Hull 3212 Boston 982 Bristol 443 Tonbridge & Malling 427
Hammersmith & Fulham 2451 Doncaster 727 Doncaster 442 East Lindsey 322
Lewisham 2131 Thurrock 659 Tonbridge & Malling 427 York 321
North Somerset 2064 Selby 650 Greenwich 339 Shropshire 316
Lambeth 2039 Wyre 645 Lewisham 338 Chelmsford 308

As expected, most of the Top 10 LADs for Zone 3 postcodes are in London. Elsewhere, Hull and Somerset predominate, but disappear when flood defences are taken into account (i.e. Category B).

Lincolnshire, containing Boston, South Holland and East Lindsey LADs, stands out as the county with the greatest concentrations of undefended post-2008 properties.

For simplicity, the results presented do not disaggregate by property type. However, it should be noted that the Land Registry data shows that a clear majority (70%) of the properties identified in Zone 3, and 55% of the undefended properties in Zone 3, are flats (the figures are 41% and 49% respectively excluding London).

It is important to note that contents insurance for rented or leasehold flats built before 1st January 2009 is covered by Flood Re (contingent on meeting other eligibility criteria), but otherwise properties in blocks of more than three residential flats are not eligible, regardless of their age.

Although flats on upper storeys do not suffer the same direct impacts of flooding as ground floor flats and houses, access and utilities can suffer and occupants may need to be accommodated elsewhere (covered by their insurer); and the building as a whole can be deemed uninhabitable. Tenants may have the cost of high flood insurance passed onto them via management charges, and many insurers do not take storey into account when calculating premiums. It would not be valid to assume, therefore, that uninsurability is not also a potential problem for the flat dwellers in these at-risk postcodes.

By property value

As Land Registry data includes house prices, we can also summarise the results of our analysis of at-risk properties, by property value.

Table 3 below lists the ten LADs with the greatest estimated value of post-2008 properties in Flood Zone 3, both as a whole (Category A) and undefended (Category B), including and excluding London.

Table 3. Local authority districts with the greatest value of post-2008 properties in Flood Zone 3, both as a whole (A) and undefended (B), including and excluding London

A: value of post-2008 residential properties in Flood Zone 3 B: value of post-2008 residential properties in Flood Zone 3, undefended
incl. London excl. London incl. London excl. London
local authority £ million local authority £ million local authority £ million local authority £ million
Southwark 4527 Kingston upon Hull 472 Wandsworth 262 South Holland 173
Wandsworth 4255 North Somerset 443 Newham 215 Leeds 173
Tower Hamlets 3411 Sedgemoor 304 South Holland 173 Boston 151
Hammersmith & Fulham 2612 Dartford 260 Leeds 173 Tonbridge & Malling 117
Westminster 2299 Windsor & Maidenhead 177 Boston 151 Bristol 114
Newham 1722 South Holland 173 Greenwich 141 Windsor & Maidenhead 84
Lambeth 1712 Leeds 173 Tower Hamlets 135 York 80
Greenwich 1539 Thurrock 159 Tonbridge & Malling 117 East Hertfordshire 73
Lewisham 804 Boston 151 Bristol 114 Brighton & Hove 72
Kingston upon Hull 472 Tonbridge & Malling 130 Lewisham 93 Worthing 70

Property prices are converted to 2015 equivalents using the UK House Price Index

This analysis suggests that, in total, about £31 billion worth of property has been built in Zone 3 after 2008, of which about £5 billion is undefended.

The results are similar to Table 2, with the promotion of London and south-eastern LADs up the rankings.

A large proportion of the total £31 billion figure refers to the parts of London protected by the Thames Barrier, as would be expected. However, there is also at least £700 million pounds worth of post-2008 property in Flood Zone 3 in Somerset (North Somerset and Sedgemoor); and hundreds of millions of pounds worth of property which is neither eligible for insurance via Flood Re nor protected by flood defences in parts of London, Lincolnshire and Yorkshire.


Greatest at-risk properties

There has been apparently very little new building in some of the greatest at-risk postcodes, defined earlier (Category C) as those areas where at least half of all residential properties have a 1-in-30 or higher annual chance of flooding, irrespective of defences. Land Registry data suggests there have been about 3,000 properties built in England in these postcodes since 2009.

Table 4 below shows the top five LADs for the greatest at-risk postcodes, by number and value of these properties.

Table 4. Local authority districts (LADs) with the greatest number and value of post-2008 properties in the greatest at-risk category of postcodes

C: At least 50% of residential properties in postcode are at High risk (>3.33%) of flooding
no. post-2008 properties value of post-2008 properties
local authority no. local authority £ million
Lewisham 297 Lewisham 99
Leeds 261 Kingston upon Thames 58
Kingston upon Thames 200 Leeds 41
Doncaster 160 Windsor & Maidenhead 34
Canterbury 141 Medway 17

At this level we might be talking about only a few blocks of flats, or a couple of new housing estates.

Some particular clusters of note from Table 4 are the area near the confluence of the Rivers Quaggy and Ravensbourne in Lewisham; the outskirts of Mexborough near Doncaster; and an area near where the Stour branches in central Canterbury.


Future housebuilding

20,000, even 70,000, properties that are at-risk of not having flood insurance are not large numbers in terms of the current total UK housing stock. However, it is just as well to develop some foresight on this issue for certain specific locations, and in the light of current trends.

According to the Environment Agency, the number of properties in the flood plain is set to almost double over the next 50 years, if current planning outcomes continue [viii]. As a consequence, under its current rules, there will be growing numbers of at-risk properties which are not entitled to insurance via Flood Re.

It is worth highlighting what the National Planning Policy Framework states [ix]:

“Inappropriate development in areas at risk of flooding should be avoided by directing development away from areas at highest risk (whether existing or future). Where development is necessary in such areas, the development should be made safe for its lifetime without increasing flood risk elsewhere.”

A sequential test is applied to “steer new development to areas with the lowest risk of flooding”, and where this is not possible it must be demonstrated that “the development would provide wider sustainability benefits” which outweigh the flood risk. Developers are required to undertake a site-specific flood risk assessment in areas at risk of flooding when applying for planning permission, including how the site is likely to be affected by climate change.

Given the pressure local authorities are under to build houses and the land constraints they face, it is unrealistic to expect there will be no building in Zone 3 (Category A) areas. Therefore, homeowners of new properties need to be fully informed of their flood risk, and this should include giving them a heads up that their risk may increase with climate change and they may find it hard to get insurance.

While climate change may be taken into account in the planning process, this information is not readily accessible to householders, and it’s fair to say it would probably not occur to the vast majority of people to consider it.


The future of Floor Re

Flood Re has extended affordable flood insurance cover to many householders who would otherwise not have had it. However, the new government-commissioned Flood Insurance Review will no doubt spark a debate about whether everyone who could benefit from the Flood Re scheme is doing so.

The question of whether it is fair or effective (in public policy terms) to have set a retrospective cut-off date of 1st January 2009 is central to the debate. Indeed, the head of general insurance at the UK’s largest insurance company, Aviva, recently said that it should be extended to apply to homes built after this date, in conjunction with improved planning and resilience [x].

Concerns over moral hazard are valid. Given that policyholders are cross-subsidising risky households via Flood Re, it is important to keep the costs down for everyone and disincentivise poor development choices. It is also reasonable to assume that property owners should take on some degree of personal responsibility to understand and reduce their flood risk.

However, the cost of flood insurance can only be a disincentive for house-building if it in some way affects the developer’s bottom line.
Basic economic theory would assume a world of rational home-buyers perfectly informed about their flood risk, factoring potential future costs into the amount they are willing to pay for a house, and balancing these against the desirability of other features. In this world, they pay a lot less to developers for their flood-prone houses, creating a financial incentive for them to build somewhere else.

So much for the textbooks — are we really confident this is what has actually happened? A 2013 survey for the Environment Agency found that over half of people living in flood risk areas either don’t know or don’t accept their risk [xi].

Is it really the case that everything has been done to inform homebuyers of their flood risk? The Pitt Review of lessons learned from the 2007 floods recommended that flood risk should be part of mandatory search requirements during property purchase twelve years ago [xii]. This led to the inclusion of flood risk information in Home Information Packs, which were given to homebuyers and included a Property Information Questionnaire with details on flood risk – but this policy was discontinued in 2010. It would be the height of naivety to believe that homebuyers understand their flood risk in a changing climate — including potential uninsurability — when accessible public information isn’t yet available on future flood risk. This looks like a case of information failure.

A Government note on the flood risk information currently available to homebuyers, linked to the Water Act of 2014 (which established Flood Re) while in its Bill stage, stated [xiii]:

Surveys/investigations into flood risk are not required by law. It is a well-established principle of the conveyancing process that the onus is on the buyer of a property to conduct their own searches and investigations into the potential risks to that property.

In other words, caveat emptor, end of story. If policymakers are serious about helping ordinary members of the public deal with climate impacts then this needs to change.


Policy recommendations

Four specific policy recommendations are as follows:

The new Secretary of State for the Environment should continue with the Flood Insurance Review and, as part of it, consider a reset for the cut-off point for Flood Re eligibility.

There are at least two grounds for this: (i) the Government has not done enough to inform new-build homebuyers of their flood risk over the past decade; and (ii) there is no evidence the cut-off has succeeded in its policy aim of disincentivising development in at-risk areas.

A later cut-off point for eligibility should be determined in conjunction with a clear strategy to: (i) provide new and better information on flood risk (see below); (ii) ensure property-level resilience is being advanced (see below); and (iii) engage the public on this issue, and inform them of any responsibilities policymakers believe them to have.

Regarding the extra cost of extending the Flood Re scheme, having an estimate of the number of properties involved, similar to the one we have attempted in this analysis, would at least allow an informed discussion of the likely cost, and potential revenue sources to cover it.

Given the growing prominence of flooding, it should be considered that, if asked whether they would be willing to pay a little extra on their home insurance policies to help others, members of the public might well agree.

Introduce new mandatory Flood Performance Certificates (FPCs) for all homes being sold with information on property-level resilience, Flood Re eligibility, government advice on reacting to flooding, information on flood defences, and the impact of climate change on future flooding risk.

Failing this, sellers, conveyancing solicitors or landlords should be obliged to provide a recognised flood risk report (for example a Land Registry flood risk report) to all people purchasing properties.

Property purchase is an ideal moment to alert homebuyers to actions they can take to make their property more resilient.

The Social Market Foundation, in research for Flood Re, have previously suggested the introduction of “Flood Performance Certificates” (FPCs), analogous to Energy Performance Certificates, to summarise flood risk information for homebuyers [xiv]. They suggested FPCs could cover flood risk and history, any resilience measures that have been recommended by a surveyor, and an assessment of whether they have been taken up.

Building on this, these FPCs could also include: (i) eligibility for insurance via Flood Re, and where eligible, the fact that this will be withdrawn from 2039; (ii) government advice on how to react to flooding events; (iii) information on defences in their area; and (iv) a basic statement that their flood risk may increase due to climate change.

Ultimately, forward-looking flood risk information incorporating climate change and sea level rise should be provided. The Committee on Climate Change (CCC) note that there is currently no national map of future flood risk [iv]. If possible, the Environment Agency should be given appropriate support to expedite this.

Flood risk reports are available via the Land Registry at a cost of £10.80 including VAT, a negligible sum. Either sellers and landlords could be required to obtain this and give it buyers or tenants; or it could be required of conveyancers, passing the cost onto their client in their fees.

Reform the Building Regulations so by a set date all new-build properties in Zones 2 and 3 have property-level flood resilience (PFR) measures.

Reform the National Planning Policy Framework to strengthen importance of PFR measures.

Require all local authorities to monitor and report on the extent to which at-risk properties in their area have PFR measures.

Property-level flood resilience (PFR) refers to modifications to properties to enable them to incur lower damages and recover more quickly from flooding, such as flood protection barriers, raised electrics and tiled floors. Figures compiled by the Committee on Climate Change (CCC) indicate that the total number of properties which have installed property-level flood resilience measures are probably in the low thousands, with annual uptake estimated at 415 properties per year [iv]. The CCC point out this is a long way short of the rate required both to phase out Flood Re and “to adapt to even a 2ºC global temperature scenario”.

Flood Re consider uptake of flood resilience measures to be a core component of how the market can transition away from the scheme by 2039 [xv] and have called for premiums to take them into account [iii].

Defra has convened a Property Flood Resilience Roundtable which recently published a draft voluntary Code of Practice on PFR [xvi], and one of its Task Groups has been examining the role of building regulations [xvii].

While civil servants and industry stakeholders work on the technical aspects of such proposals, what is needed is for the Government to set some clearly signposted ambitious goals for developers, insurers and local authorities. For example, changing the Building Regulations so that by a reasonably near-term set date (before 2025) they will include PFR measures for properties in Zones 2 and 3. This could leverage the dialogue already taking place amongst knowledgeable stakeholders and give it a destination.

Furthermore, the National Planning Policy Framework could include stronger statements on PFR, and local authorities could be required to monitor and report on the extent to which at-risk properties in their area have PFR measures.

At a minimum there could be a public information campaign on PFR targeted at priority at-risk and recently flooded communities.

The Government should identify, map and monitor ‘flood risk hot spots’ – areas of the country particularly at risk of widespread and consequential impacts from flooding.

In the years ahead, there will be areas of the country that will be particularly at risk of widespread and consequential impacts from flooding.

These areas will not just be defined through physical risk, but through predisposition to social, economic, public safety, public order or even national security impacts. These severe impacts will be shaped by factors such as lack of insurance coverage, livelihoods vulnerable to flooding (such as farming), dependence on at-risk infrastructure, possible emergency response difficulties, likely ineligibility for flood defences and social vulnerability. For example, given the importance of Lincolnshire and the Fens in food production, their vulnerability to sea level rise and flooding is a potential issue of national importance.

In addition to identifying and monitoring these hot spot areas, it may be worth reviewing whether current Environment Agency flood appraisal practices could better incorporate such concerns.


Conclusion

This analysis does not cover other problems with flood insurance, namely: the fact that despite the existence of Flood Re some people who should be eligible still find it a challenge to obtain insurance [xviii]; low insurance uptake amongst renters [xix]; lack of business insurance cover already starting to have localised economic impacts [xx]; and, householders being unwittingly caught out by cheap household insurance with no flood component [xxi]. Instead, it focusses on a specific part of the problem.

Box 1. Summary of main findings

  • There are at least 70,000 residential properties that have been built in Flood Zone 3 in England since 1st January 2009 which are at risk of becoming uninsurable, because they are ineligible for flood insurance via Flood Re.
  • A majority of these 70,000 at-risk properties are in Greater London. Other notable clusters include Hull and Somerset.
  • 20,000 of the 70,000 at-risk properties are in areas without flood defences. Lincolnshire, containing Boston, South Holland and East Lindsey local authority districts, stands out as the county with the greatest concentrations of undefended at-risk properties.
  • About £31 billion worth of at-risk properties have been built after 2008, although a substantial proportion of this is protected by the Thames Barrier. About £5 billion worth is undefended. Hundreds of millions have been spent building at-risk properties in Lincolnshire, Somerset and Yorkshire.
  • There are around 3,000 properties that are greatly at risk, since they are not covered by Flood Re and are located in areas where at least half of all residential properties have a 1-in-30 or higher annual chance of flooding, irrespective of defences.

We are making choices about who bears the cost of climate change, whether they’re explicit and deliberate or not. Even well-resourced companies and institutions are struggling to understand climate risk; so of course we shouldn’t expect ordinary members of the public to navigate it unaided. As a society we mustn’t sleepwalk into loading the costs of climate change onto those least able to bear them — in some cases, people who can’t cope with the loss of a fridge full of food, let alone afford to refurbish a property [xxii].

If a political decision has been made not to cross-subsidise the flood insurance of people in newer houses, but housing pressure means they are exposed to foreseeable climate impacts, then at the very minimum the Government should step in to ensure they are informed of this risk. Many of the people seeing their communities deal with the impacts of flooding would view the current onus on individual responsibility as a bit heartless.

Box 2. Summary of main policy recommendations

The new Secretary of State for the Environment should continue with the Flood Insurance Review and, as part of it, consider a reset for the cut-off point for Flood Re eligibility

Introduce new mandatory Flood Performance Certificates (FPCs) for all homes being sold with information on property-level resilience, Flood Re eligibility, government advice on reacting to flooding, information on flood defences, and the impact of climate change on future flooding risk.

Sellers, conveyancing solicitors or landlords should be obliged to provide a recognised flood risk report (for example a Land Registry flood risk report) to all people purchasing properties.

Reform the Building Regulations so by a set date all new-build properties in Zones 2 and 3 have property-level flood resilience (PFR) measures.

Reform the National Planning Policy Framework to strengthen importance of PFR measures.

Require all local authorities to monitor and report on the extent to which at-risk properties in their area have PFR measures.

The Government should identify, map and monitor ‘flood risk hot spots’ – areas of the country particularly at risk of widespread and consequential impacts from flooding.

There needs to be a renewed focussed on dealing with flood risk as a dynamic, not a static, issue, and a much stronger presumption in policymaking that the transition to a flood resilient society won’t just happen without government intervention. Hard-working civil servants can do a lot, but when it comes to injecting values and ambition into the process, there is no substitute for political leadership.

Helen Jackson is an Associate Fellow at Bright Blue.

Helen Jackson is an environment and natural resource economist with many years’ experience in climate change, energy and environmental policy, working for both the public and private sector. She was one of the first people to work for leading climate and energy consultancy Vivid Economics, with whom she has undertaken projects for UNEP-FI, multilateral development banks, the International Maritime Organisation, energy companies and the UK government, including Brexit-related work for Defra.

Helen has also worked for the Climate Bonds Initiative, contributing to the development of their Standard and Certification Scheme to flag green bonds compatible with a low carbon economy. With them, she has researched in-depth issues surrounding climate adaptation in the electricity sector. Helen’s current main interests are: understanding climate risk and adaptation challenges, both to the economy and society as a whole; and the application of data science to environmental challenges. She has written for Prospect, and her past work has been cited by The Rough Guide to Economics and David Cameron.

The views expressed in this essay are those of the author, not necessarily those of Bright Blue.


Acknowledgements

The author would like to thank Dr Mike Steele of the Environment Agency, Mary Dhonau of Know Your Flood Risk and Emma Bergin of Flood Re for taking the time to provide technical information relevant to this research; and Chris Bell for his batch geocoding tool.

Contains public sector information licensed under the Open Government Licence v3.0 (EA flood maps). Contains HM Land Registry data © Crown copyright and database right 2019 licensed under the Open Government Licence v3.0. Contains Office for National Statistics data licensed under the Open Government Licence v.3.0 (postcode data). Contains OS data © Crown copyright and database right 2018 (rivers shown on maps).


References

[i] Camilla Hodgson, “Thousands of new homes to be built on England’s floodplains”, Financial Times, 21 December, 2019.

[ii] Sandra Laville, Hundreds miss out on flood grants due to ‘obscene postcode lottery’The Guardian, 30 January, 2020.

[iii] Flood Re, “The Quinquennial Review”, 2019.

[iv] Committee on Climate Change, “Progress in preparing for climate change – 2019 Progress Report to Parliament”, 2019.

[v] “Flood map for planning”, https://flood-map-for-planning.service.gov.uk/.

[vi] “Flood warning information service”, https://flood-warning-information.service.gov.uk/long-term-flood-risk/map/

[vii] See category explanations at https://flood-warning-information.service.gov.uk/long-term-flood-risk/map

[viii] Environment Agency, “Long-term investment scenarios (LTIS) 2019”, 2019.

[ix] HM Government (2019), National Planning Policy Framework, February 2019 version.

[x] Oliver Ralph, Call for UK flood insurance scheme to be extendedFinancial Times, 2 February, 2020.

[xi] Committee on Climate Change, “Managing climate risks to well-being and the economy: ASC progress report 2014”, 2014.

[xii] Sir Michael Pitt, “Learning lessons from the 2007 floods”, 2008.

[xiii] Department for Environment, Food and Rural Affairs, “Water Bill: Part 4 – Flood insurance, Homebuyers and their flood risk”, 2014.

[xiv] Social Market Foundation, “Sellers and landlords should have “Flood Performance Certificates” for homes”, (2018).

[xv] Flood Re, “Securing a future of affordable flood insurance”, 2018.

[xvi] CIRIA, “Code of Practice and guidance for property flood resilience – RP1055”, Construction Industry Research and Information Association, 2020.

[xvii] Department for Environment, Food and Rural Affairs, “The Property Flood Resilience Action Plan”, 2016.

[xviii] Somerset Rivers Authority, “Survey results show flood insurance remains ‘big challenge’”, 2019.

[xix] Department for Environment, Food and Rural Affairs, “Affordability and Availability of Flood Insurance”, 2015.

[xx] Charlotte Becquart, “Inside the UK’s most flooded town which is battling to prevent a disaster”, CornwallLive, 1 February, 2020.

[xxi] Miles Dilworth, “Sunk by the small print: Flood victims are shocked to discover their insurance is worthless”, Daily Mail, 19 December, 2019.

[xxii] The Climate Coalition, “Home Truths: How Climate Change is Impacting UK Homes”, 2020.

[xxiii] Ministry of Housing, Communities and Local Government, “Land Use Change Statistics”, Tables P320 and P321.

[xxiv] Josh Halliday, “One in 10 new homes in England built on land with high flood risk“, The Guardian, 19 February, 2020.

Annex

Land Registry Price Paid Data was downloaded on 10th January 2020, with the most recent records being for the end of November 2019. Each post-2008 property in the dataset was paired with the latitude and longitude of its postcode using the ONS Postcode Directory. Land Registry postcodes not found in the ONS Postcode Directory were examined and, where necessary, corrected.

Comparison between these results and MHCLG data [xxiii, xxiv] suggests this analysis does not capture all new builds in Zone 3. It is, however, able to provide a rough indication of where properties have been built in the categories described since 2009. Official data suggests approximately 84,000 properties have been built in Zone 3 since 2013. Some potential reasons for this discrepancy are as follows.

Land Registry data excludes certain types of property transaction. A list can be seen here.

Environment Agency shapefiles for Flood Zone 3 and areas benefitting from flood defences were downloaded. It was then determined whether postcode latitudes and longitudes where located in Categories A and B through geospatial analysis in R. All coordinates were converted to the WGS84 coordinate system.

In addition, Category C properties were determined by directly comparing postcodes with the Environment Agency’s Risk of Flooding from Rivers and Sea – Postcodes in Areas at Risk dataset.

Property prices recorded in Price Paid Data were converted to 2015 house prices using the UK House Price Index. Given that the rate of property price increase can vary considerably regionally, the HPI figures for the appropriate local authority district for each property was used.

Note that using postcode centroids rather than the exact location of each property will have introduced some inaccuracy into the estimates, and all estimates should be viewed as approximate. A more accurate method would have been to use the Ordnance Survey’s AddressBase product to identify the coordinates of each individual property. This was not attempted due to time constraints and the problem of accurately matching Land Registry data, which is not always formatted consistently, to unique properties in a different dataset.

Properties which were new builds at time of sale were easily identifiable from a field in the data stating this. However, a further source of potential inaccuracy is the fact that Land Registry data contains the date of transaction, while the Flood Re cut-off is based on date of build. For this reason, there will be some properties included in the estimates above which were built before January 1st 2009, but sold after January 1st 2009. Using a later date to filter the Land Registry data to account for this was considered, but it was decided that this would be fairly arbitrary and possibly introduce its own inaccuracies. Therefore date of sale should be viewed as a proxy for date of build in the absence of better data.

Anvar Sarygulov: Immediate public expectations of and priorities for the Conservative Government

By Anvar Sarygulov, BB Research, Centre Write, Politics

The Conservatives have secured a large majority in the 2019 General Election. A significant component to their success has been winning over voters which have not traditionally voted Conservatives, particularly amongst members of the working class in northern parts of England and Wales

While Brexit played a significant role in this, it is also important to acknowledge other policy shifts which have contributed. Boris Johnson’s Government has promised to break with the austerity that defined the 2010s, pledging more public spending, particularly for key public services such as the NHS and schools. Furthermore, with commitments to raise the minimum wage and infrastructure spending, Boris Johnson’s Government appears to be more economically interventionist than previous Conservative administrations. 

As the 2020s begin, it is worth reflecting on public expectations of and priorities for the new Conservative Government. Many promises have been made by the Conservatives during the election, especially for its new group of supporters on modest incomes. To what degree does the public expect these promises to be delivered? Are there policies which the public thinks would be of particular help to people on low and middle incomes, and to those living in areas described as ‘left behind’? And are there policy areas to which the public wants the Conservative Government to give greater priority to?

To answer these questions, we have conducted public polling, in partnership with Opinium, to examine public expectations of and priorities for the new Conservative Government.

Methodology

Polling was undertaken by Opinium and conducted between 20th and 30th December 2019, immediately after the General Election. It consisted of one nationally representative sample of 2,003 UK adults. From this overall sample we also have subsets of those who have voted Conservative (711), Labour (561) and Liberal Democrat (205) in the 2019 General Election. The sample was weighted by Opinium to reflect a nationally representative audience.

For nearly all questions, respondents could answer ‘Don’t know’. These responses are not shown in the below graphs for stylistic reasons. However, a link to the full data tables can be found at the bottom of this piece.

  1. Public expectations of the Conservative Government

In 2019, the Conservatives won record levels of support amongst those who are on low incomes. Despite this, the UK public is most likely to believe that the richest in society will do best under the new Conservative Government, with almost half (44%) indicating this, as Chart 1 indicates. In contrast, only 13% of the UK public believe that the working class will do best, and only 2% believe the poorest will do best.

However, as Chart 1 indicates, expectations of who will do best are heavily informed by political views. Conservative voters have notably different perceptions, believing first the middle class will do best (31%) and second the working class will do best (23%), while in contrast, more than three-quarters (76%) of Labour voters think the richest will do best.

As can be seen in Chart 2, the UK public is fairly pessimistic about the next five years. A majority of the UK public expects levels of undesirable trends – poverty (72%), crime (71%), inequality (71%) and national debt (72%) – to increase or stay the same. 

There is slightly less pessimism around the British economy: a slight majority expect the number of businesses (51%) and jobs (57%) to increase or stay the same, and a significant 70% expect wages to increase or stay the same over the next five years.

Furthermore, a minority (34%) of the UK public expect immigration to decrease under the new Conservative Government, despite this being a pledge in the recent Conservative Party manifesto.

There is a range of expectations in relation to high-profile policy promises that the Conservatives made during the 2019 general election campaign. As can be seen in Chart 3 below, a majority of the UK public expect the Conservatives to raise the National Insurance threshold to £12,500 (57%), to increase the national minimum wage to £10.50 (52%) and to reduce the number of low-skilled immigrants coming to Britain (54%). 

However, there is more scepticism on other high-profile commitments made by the Conservative Party. A majority of the UK public do not expect the Conservatives to deliver on ending rough sleeping (68%), a complete roll-out of fibre broadband (54%), and 50,000 more nurses (51%).

2. Public priorities for the Conservative Government

With the emphasis on Brexit during the 2019 general election campaign, it is unsurprising that a clear majority of both the British public (58%) and Conservative voters (62%) expect passing the Brexit legislation and leaving the EU to be the main priority for the new Conservative Government, as Chart 4 below shows. The NHS comes a distant second at 10% for all and 13% for Conservative voters. Labour and Liberal Democrat voters also have a similar view, with the majority (58% and 67% respectively) believing that Brexit will be priority.When discussing the main priority for increased public spending, the NHS comes significantly ahead of all other areas, as seen in Chart 5 below, with a firm majority of both the British public (57%) and Conservatives (58%) choosing it.

We tested public perceptions of whether the Conservative Government would and should prioritise key policy issues. As seen in Chart 6 below, the UK public is more likely to expect Boris Johnson’s Government to place low priority on almost all key policy issues, including climate change (47%), air pollution (48%), race and gender discrimination (57%), childcare (52%), pension reform (47%), Universal Credit (48%), integration of immigrants (46%) and human right violations abroad (61%). 

The only key policy area polled which the UK public are more likely to expect to be high priority than low priority is social care, with 41% stating this.

Hence, there is a significant gap between the level of priority that the UK public expects and wants to place on these key policy issues. The key policy issue the UK public wants to be a high priority is social care, with 73% wanting it to be a high priority issue. Coming joint second, 64% of people want climate change and air pollution to be a high priority issue. In addition, 58% of the public want pension reform to be a high priority issue, closely followed by childcare (55%) and Universal Credit (55%). 

3. Public priorities for supporting those on modest incomes

The British public is fairly divided on what the new Conservative Government should prioritise to support those on low and middle incomes. 

As seen in Chart 7 below, investing more in public services is the most popular choice among the UK public, with 27% believing this to be the best priority to support those on low and middle incomes. Next, 23% saw increasing the minimum wage as the priority for those on low and middle incomes, followed in third place by 16% of the UK public believe that cutting taxes is the best option. 

Notably, as Chart 7 illustrates, Conservative voters are almost equally split between these three top choices, but with increasing the minimum wage their preferred choice with 27% reporting this, followed by investing more in public services at 26%.


The variation of views on priorities across different income bands is also notable, as can be observed in Chart 7a below. Generally, those with lower incomes are more likely to report increasing the minimum wage than any other measure. For example, those earing below £10,000 and between £10,000 and £20,000 a year are more likely to say the increase in the minimum wage should be the priority compared to other priorities, including investing more in public services but especially cutting taxes.

Since the vote to leave the EU in the 2016 referendum, there has been a determination by politicians and policymakers – including in the Conservative Party – to better support so-called ‘left behind’ areas, which refers to a variety of post-industrial and coastal areas across England and Wales. 

When thinking about what would best help these ‘left behind’ areas, the UK public is also fairly split, though some options are notably more popular than others. As Chart 8 indicates, incentivising new businesses to move into such areas is the top choice among the UK public, with 42% supporting this. Investing more into public services is the second most favoured option and supported by 33%. In joint third is improving transport connections and funding training schemes, with both receiving support from 30% of the UK public. 

There is some variation across voters of different parties, with a majority of Conservatives viewing incentivising new businesses (51%) as one of the best ways to help people in ‘left behind’ areas, while Labour voters were more likely to choose investing in public services (44%). However, many of the prescriptions share relatively similar levels of support across the political spectrum.4. Public perceptions of the Conservative Party

The perceptions of the Conservative Party in the 2020s are quite varied, though their focus on Brexit has successfully entered public perception, with the description of ‘a Brexit party’ being the one used by most by UK respondents (39%). Chart 9 below demonstrates this. The next popular descriptions used are ‘an elitist party’ (27%) and ‘a far-right party’ (20%), but also ‘a one-nation party’ (16%).

It is worth noting that there is significant variation by how people voted in the last election, as Chart 9 highlights. Negative descriptions, especially of the Conservative Party being ‘elitist’ and ‘far-right’, are largely driven by voters of other parties. Conservative voters are more likely to report the Conservative Party as ‘a Brexit party’ (34%), ‘a one-nation party’ (31%), ‘a people’s party’ (25%) and ‘a moderate party’ (21%). Conclusion

This polling is a snapshot of UK public opinion at the start of the 2020s. It should be seen primarily as a warning for the Conservative Government, highlighting that the trust placed in it by its new voters in northern England and Wales is fragile. The Prime Minister is right to say that first-time Conservative voters have lent their support to him; he now needs to earn their trust.

Overall, the public is pessimistic about the direction of societal and economic issues over the next five years and believes that the Conservative Government will deliver on only some of the promises made during the 2019 general election campaign. There is a significant expectations gap on a range of environmental, social and welfare issues, with many wanting the Government to give them a higher priority than what is currently expected. 

At the same time, this polling suggests that the Conservative Government has significant room to exceed people’s expectations. The public’s policy priorities on helping those on low and middle incomes and left-behind areas are mostly in line with the Conservative Government’s agenda, including investing in key public services, improving transport connections and training opportunities, and attracting business investment. Should the Conservatives deliver on this domestic agenda, they are likely to maintain the trust of their new electoral coalition.

Anvar Sarygulov is a senior researcher at Bright Blue


Notes:

The full data tables for the polling can be found here.

We are grateful to Opinium for advising on and carrying out the survey.