Summary
This analysis unearths public attitudes on the importance of and potential policies for greater and greener housing and infrastructure development levels in the UK.
The specific policies examined herein are derived from the two major Bright Blue research papers that have been completed over the last year. The first paper, Greater and greener homes: more homes, ready for net zero, proposed new policies to achieve two core policy objectives: to speed up the delivery of new homes where development is most sustainable; and to ensure new homes are compliant with reaching net zero greenhouse gas emissions by 2050. The second paper, Resilient neighbourhoods, powered by low-carbon energy, suggested policies for the increased development levels of renewable energy infrastructure, and in particular wind and solar power.
In general, through the course of our research on greater and greener development, we sought to reconcile two key objectives in housing and infrastructure policy: the socio-economic, such as more and affordable homes for young people, and more secure and affordable energy; and the environmental, such as reducing greenhouse gas emissions and improving biodiversity.
The findings of our papers, combined with the findings of this polling, provide strong policy ideas for — and a strong case to — the Government for improving the development levels of UK housing and infrastructure in a way that is consistent with environmental ambitions.
The key findings are:
Climate risks
- A plurality of the UK public (34%) is not too concerned about their home’s ability to withstand future climate-related emergencies.
- Half (50%) of the UK public say the climate risk they are most concerned about is extreme weather events, such as storms, for their own home and neighbourhood.
- A large plurality of the UK public (48%) had no flood resilience measures introduced to their home or local area, as far as they are aware.
Housing and infrastructure development
- A plurality of the UK public (31%) thinks that between 70 and 85% of UK land should remain undeveloped in the long term.
- An overwhelming majority of the UK public (75%) support more green housing – such as housing with exceptionally low carbon emissions and high energy and water efficiency – being developed in their local area.
- A majority (55%) of the public say they support new housing development in their local area if it meets high environmental standards.
- A majority of the UK public (52%) claim that they are more likely to support a new development in their local area if it is particularly climate resilient.
- A plurality of the UK public (47%) think that the development not releasing new pollutants into the water or air is one of the top two pro-environmental adjustments that would make them more supportive of new development in their local area.
- A large majority of the UK public (65%) support new onshore wind power development, either unconditionally of its location or only in certain areas.
- A majority of the UK public (58%) who only support onshore wind development in certain areas think that green belt land should be excluded from onshore wind development.
- A plurality of the UK public (41%) think it should be easier to acquire planning permission to build onshore wind farms.
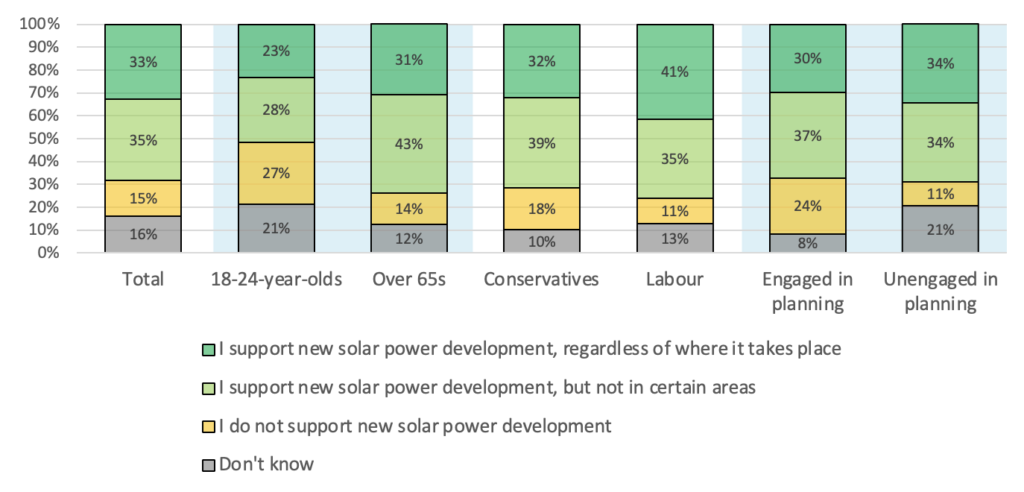
- A majority of the UK public (68%) support the development of new solar farms, either unconditionally of its location or only in certain areas.
- Of those who support solar power development only in certain areas, a majority (57%) think that green belt land should be excluded from solar farm development.
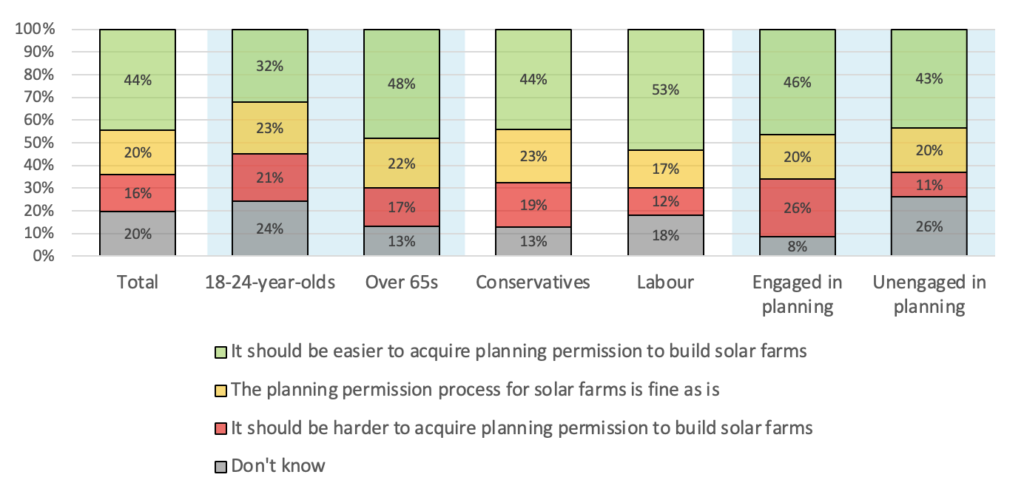
- A plurality of the UK public (44%) believe that it should be easier to acquire planning permission to build solar farms.
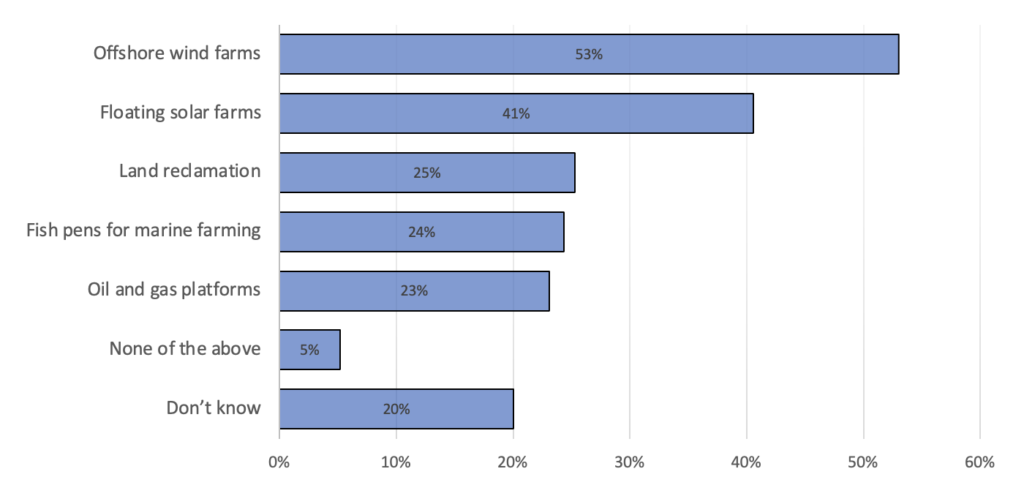
- When given a choice between different development priorities for English offshore waters, 53% of UK public believe that offshore wind farms should be a priority, and 41% believe that floating solar farms should be a priority. By contrast, only 23% think that oil and gas platforms should be a priority.
- A plurality of the UK public (31%) have no concerns regarding developers building housing in a way such that it emits less carbon.
- A plurality of the public (41%) would have neither a positive nor a negative response to their neighbour installing a heat pump outside their home.
- A majority of the UK public (58%) would have a positive reaction to their neighbour installing solar panels on the roof of their home.
Policies for greater and greener development
- A plurality of the UK public (35%) is supportive of densifying their local street.
- A majority of the UK public (48%) is supportive of developing new settlements in undeveloped nearby areas.
- A majority of the UK public (59%) believe that local planning authorities should be rewarded by central government in exchange for proactive planning for more renewable energy infrastructure developments, such as onshore wind and solar power.
- A large majority of the UK public (72%) think that it is important for community benefits to be offered to the local community when a new onshore wind turbine is proposed nearby.
- A large majority of the UK public (71%) think that it is important for community benefits to be offered to the local community when a new solar power farm is proposed nearby.
- The overwhelming preference among the UK public for community benefits is for money off energy bills, chosen by 46% of the UK public.
- A majority of the UK public (66%) have said that the support of the local community should be needed to develop a new wind turbine.
- A plurality of the UK public (33%) is unlikely to participate in creating a community-led development proposal for their local area.
- A plurality of the UK public (45%) would be likely to join a community energy group.
- A majority of the UK public (65%) support mandating that a greater proportion of new and existing buildings have solar panels fitted to them.
Being a 2019 Conservative voter, being educated to a lower level and having a lower household income are all generally associated with consistently less positive views about new pro-environmental housing or infrastructure development, but those engaged with the planning system consistently respond more positively than the average member of the UK public for ideas for new pro-environmental housing or infrastructure development. Less prominently, residing in a rural area is generally associated with less positive views about new environmentally-friendly development nearby, while identifying as ethnically non-white is generally associated with having a more favourable view of the development of new settlements and of community energy groups.
The most prominent divide in UK society, however, often remains to be age. Interestingly, younger people are less supportive of new renewable energy infrastructure development. This goes against the sometimes prevailing narrative that older people are opposed to new development. Nonetheless, younger people are more supportive of the greater development of environmentally-friendly housing. Moreover, younger people show greater levels of concern regarding the climate resilience of their homes and awareness of flood resilience measures, however, they are relatively less concerned about extreme weather events. Finally, they are less concerned about local community support when it comes to new development, are less supportive of new settlements and are less likely to participate in creating community-led local development plans, but are more likely to participate in community energy groups.
Based on our findings, Bright Blue proposes four key policy aims that the UK Government should adopt:
- Build more housing and infrastructure.
- Facilitate the transition of buildings towards net zero.
- Consider the interests of the community when bringing forward development.
- Facilitate the development of more renewable energy infrastructure, both on sea and land.
Introduction
The UK is facing sluggish economic growth and increasing intergenerational inequity. The UK economy only grew a meagre 0.1% in 2023, while adults aged 60 to 64 are nine times wealthier than those aged 30 to 34. The housing market in our country is in a state of crisis, with over four million extra homes needed for housing demand to meet supply. The high cost of living and the invasion of Ukraine by Russia have also highlighted the fragility of the UK’s energy supply. In April 2022 alone, the average household energy bill in the UK increased by a monumental 54%. These challenges require that the country builds more: more homes and more energy infrastructure. But achieving this has proven difficult.
In September 2023, the Prime Minister, Rishi Sunak, set out his “new approach” to climate policy. The tone of his speech was largely negative. “[I]t cannot be right,” the Prime Minister said, “for Westminster to impose such significant costs [in the name of pursuing climate goals].” One’s impression, listening to the speech, might be of a country embroiled in a fight where its people have been asked to sacrifice their prosperity in the name of an overzealous pursuit of climate targets.
But the public consistently realise the potential cost of not facing up to climate change. Climate change is consistently a top four issue as judged by the UK public, and we consistently support a wide variety of public policies and behavioural changes in order to mitigate the impacts of climate change. So, in the pursuit of socio-economic targets – of greater growth, more homes and cheaper energy – we need not and must not jettison our commitment to the environment.
Indeed, the transition to net zero need not be a sacrifice – it can be an opportunity. As demonstrated in Bright Blue’s reports, decarbonising our housing stock and energy supply can also mean more, better homes and cheaper, more plentiful energy.
In light of the urgency of achieving both socio-economic and environmental (both climate and biodiversity) objectives in the UK, we wanted to test public attitudes on some possible approaches to achieving both greater and greener development. Our hypothesis is that the two objectives are not in conflict; that both can and should be achieved. This analysis might provide policy ideas for — and a strong case to — government for reforming the UK’s planning system to facilitate greater and greener housing and infrastructure development.
There has been plentiful polling on reasons for support and opposition to housing and energy development, but it appears to overlook how attitudes vary among different demographics.
Methodology
Polling was undertaken by Survation and conducted between the 8th and 14th of February 2024. It consisted of a nationally representative sample of 2,243 UK adults.
The sample was derived using an online interview administered to members of the Survation Panel. Differential response rates from different demographic groups were taken into account. Data was weighted to the profile of all adults in the UK aged 18 and above. In order to be nationally representative of the UK, data was weighted by age, sex, region, highest level of qualification, annual equivalised household income, 2019 General Election Vote and 2016 EU Referendum Vote. Targets for the weighted data were derived from Office for National Statistics Data and the results of the 2019 UK General Election and the 2016 EU Referendum.
We asked respondents whether they have had any former engagement with the planning system. We did this to understand the ease with which different possible policy options could work with the UK’s current planning consenting process. We defined ‘engaged in planning’ as having done any one of the following in the past:
- Objected to a planning application in one’s local area
- Commented on planning applications in one’s local area
- Submitted a planning application
- Taken part in a campaign to stop a development in one’s local area
- Supported a planning application in one’s local area
- Spoken at a committee or meeting about planning applications
We only highlight in our analysis significant difference in attitudes between different socio-demographic and political groups.
Chapter One: Climate risks
We first asked the UK public how concerned they are about their home’s ability to withstand future climate-related emergencies, such as flooding and overheating. We asked them to take into account the location of their home – for example, whether it is located in an area with adequate flood defences and whether it is in a high-risk flood area. This was to establish public levels of concern regarding the UK’s level of preparedness towards the impacts of climate change.
As seen in Chart 1 below, a plurality of the UK public (34%) was not too concerned about their home’s ability to withstand future climate-related emergencies. A smaller proportion (28%) was somewhat concerned, and only small minorities were not at all concerned (18%) or very concerned (13%) about their home’s ability to withstand future climate-related emergencies.
Chart 1. Views of the public on one’s home’s ability to withstand future climate-related emergencies.
 Base: 2,243 UK adults.
There is some variation by socio-demographic characteristics in the public’s responses; most notably age, with younger people being generally more concerned about their home’s ability to withstand future climate-related emergencies. A majority of 18-to-24-year-olds (58%) was in some way concerned about their home’s ability to withstand future climate-related emergencies, as compared to only 23% of over 65s. Indeed, a majority of over 65s (73%) was either not too concerned or not at all concerned about their home’s ability to withstand future climate-related emergencies.
Those who have engaged in the planning system in the past were also much more likely to be concerned about their home’s ability to withstand future climate-related emergencies than otherwise; a majority of those who have engaged in the planning system in the past (55%) was in some way concerned about it. The same could be said of only 34% of those unengaged with the planning system, of whom a majority (57%) was either not too concerned or not at all concerned about their home’s ability to withstand future climate-related emergencies.
There is also a notable and expected differentiation by voting history. Those who have voted Conservative in the 2019 general election were less likely to be concerned with the climate resilience of their home. A majority of 2019 Conservative voters (65%) said that they are either not too concerned or not at all concerned about their home’s ability to withstand future climate-related emergencies. Conversely, a majority of 2019 Labour voters (52%) were in some way concerned about their home’s ability to withstand future climate-related emergencies.
Future climate risks can range from flooding, through overheating, to the introduction of new diseases. Indeed, the CCC identifies over 50 different possible such risks. Therefore, having established significant levels of concern about climate risks in general among the UK public, we asked what particular future risks resulting from climate change the public are most concerned about, grouping them according to some broad categories.
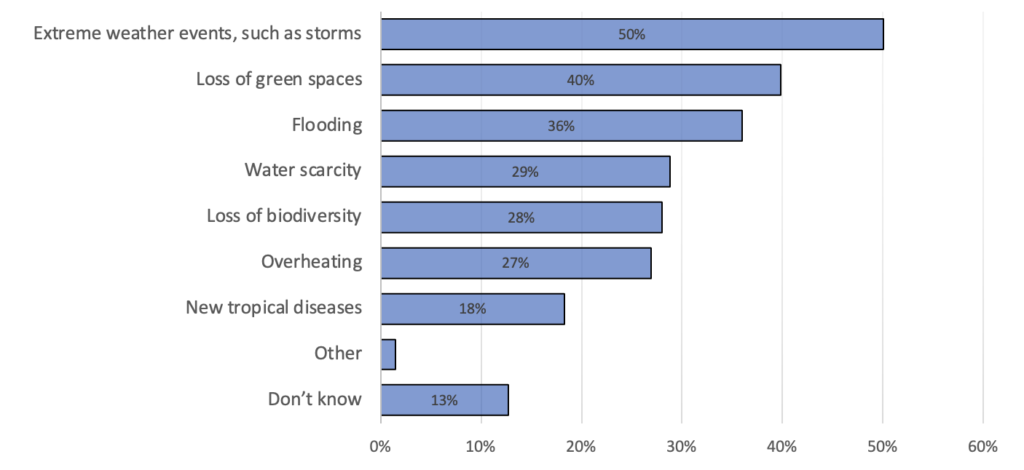
Half of the UK public (50%) said that extreme weather events, such as storms, are one of their top concerns, as shown in Chart 2 below. A large proportion of the UK public also considered the loss of green spaces (40%) and flooding (36%) as one of the most concerning climate-related risks. By contrast, only 18% of the UK public considered new tropical diseases as one of their top such concerns, and only 13% were not able to point to any particular climate-related risk that most concerns them.
Chart 2. Views of the public on the most concerning, for one’s home and neighbourhood, future risks resulting from climate change.
 Base: 2,243 UK adults.
The most significant socio-demographic variation was again age, with younger people notably less concerned about extreme weather events and water scarcity, as compared to older respondents, but slightly more concerned about new tropical diseases. A majority of over 65s (60%) mentioned extreme weather events as one of their top concerns, as contrasted to only a minority of 18-to-24-year-olds (34%), of whom a plurality (36%) said that flooding is one of their top climate change concerns. Twenty-six percent of 18-to-24-year-olds were also concerned with water scarcity as a top concern, compared to 35% of over 65s, yet 22% of 18-to-24-year-olds listed new tropical diseases as a top concern – more than the 16% of over 65s.
Variation between the responses of the UK public who have engaged with the planning system and those who have not has been limited. A majority of those unengaged with the planning system (51%) consider extreme weather events to be one of their top climate concerns, as does a plurality of those engaged with the planning system (49%). Most notable is that, of those engaged with the planning system, only 5% did not know what climate risk most concerns them; this is as compared to 17% of those unengaged with the planning system.
There was even less variation between respondents of different political allegiances. A majority of the UK public from all parties considered extreme weather events to be a top concern, with that answer being chosen by 53% of Conservative voters, 51% of Labour voters and 56% of Liberal Democrat voters.
Next, we asked the public what flood resilience measures have been introduced to their homes or to their local area. We did this to understand the relationship between individuals’ levels of concern regarding climate resilience and their home or local area already having some visible climate resilience measures present. We asked about flood resilience measures specifically to limit the number of possible answer options, and because flood resilience measures are the most recognisable type of climate resilience measures.
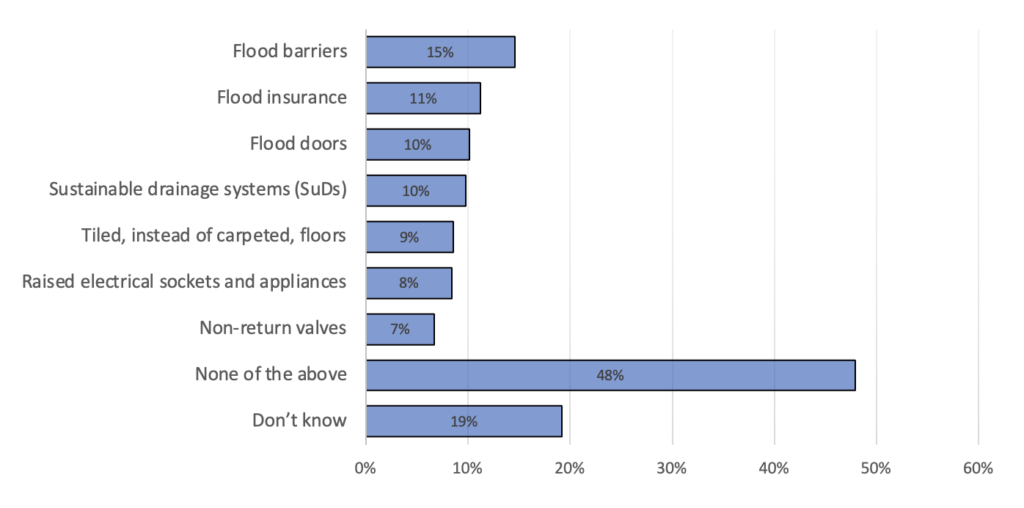
A large plurality of the UK public (48%) had no flood resilience measures introduced to their home or local area, as far as they were aware. This is shown in Chart 3 below. Of the respondents who were aware of flood resilience measures having been introduced to their home or local area, the most commonly highlighted measure were flood barriers (15%). All other responses were chosen by only between 7 and 11% of respondents.
Chart 3. Awareness of the public of the flood resilience measures protecting their home or their local area.
 Base: 2,243 UK adults.
Younger people also showed a greater awareness of the existence of flood resilience measures. A plurality of 18-to-24-year-olds (25%) claimed to be aware of the introduction of flood doors in their home of local area; only 20% of 18-to-24-year-olds claimed to be aware of no flood resilience measures in their home or local area. On the other hand, 72% of over 65s were not aware of any flood resilience measures in their home or local area. This is unlikely to be fully explained by younger people living in areas of the country with more flood resilience measures: neither the variation by region nor the variation by urban or rural residence were as strong as the variation by age in our responses.
Those engaged in the planning system showed a much greater awareness of the existence of flood resilience measures protecting their home or their local area. While a plurality of those engaged in planning (35%) were unaware of any such flood resilience measures, a majority of those unengaged in planning (55%) were unaware of them. Most strikingly, while 21% of those engaged in planning were aware of their home or local area being protected by flood insurance, the same was true for only 6% of those unengaged with planning. Since there is no prima facie reason to think that those engaged in planning are much more likely to live with flood resilience measures, this suggests that there is a significant gap between flood resilience measures existing and the public being aware of them.
Variation by voting history among the respondents to this question was only minor. Proportionally most significant was the variation between 2019 Labour and Conservative voters where it came to their home having tiled, instead of carpeted, floors. While 11% of Labour voters have tiled floors, only 5% of Conservative voters do. This reflects the broader trend of Conservative voters generally being less aware of the presence of flood resilience measures in their homes or local area, with a majority of 2019 Conservative voters (59%) being unaware of any such measures, as compared to a large plurality of 2019 Labour voters (44%).
Counter-intuitively, unawareness of the existence of floor resilience measures also correlates negatively with one’s level of concern regarding one’s home’s ability to withstand future climate-related emergencies. Those unaware of the existence of flood resilience measures were less likely to be concerned about their home’s ability to withstand future climate-related emergencies, with a large majority of such respondents (65%) stating that they are either not at all or not too concerned about their home’s ability to withstand future climate-related emergencies. This can be compared with the average response in Chart 4 below.
Chart 4. Views of the public who are unaware of flood resilience measures protecting their local area or home on their home’s ability to withstand future climate-related emergencies.
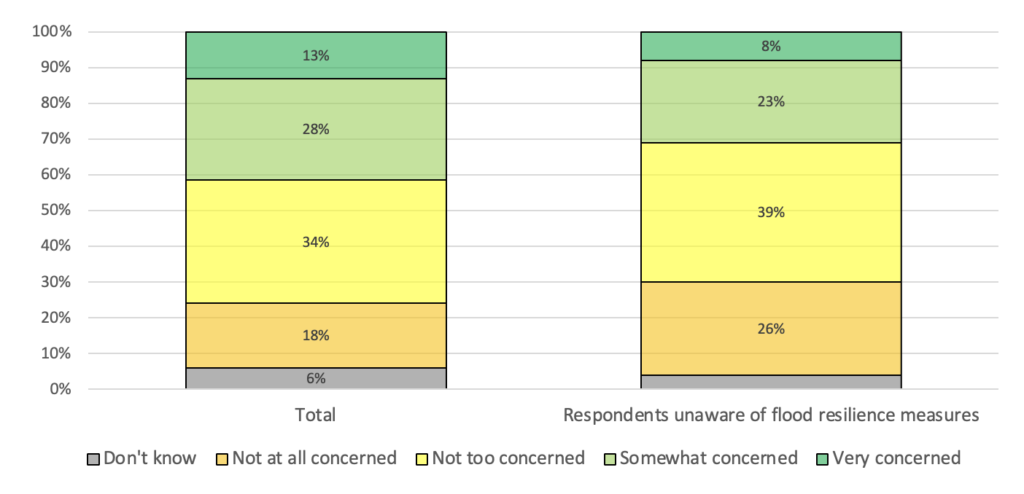 Base: 1,091 UK adults unaware of any flood resilience measures protecting their home or their local area.
Chapter 2: Housing and infrastructure
Having established that people are concerned about the effects of climate change on their homes and neighbourhoods, we wanted to test public attitudes towards new housing and infrastructure development – in particular, housing and infrastructure that is consistent with reducing carbon emissions and protecting the natural environment, both in terms of climate and biodiversity.
First, we asked what proportion of UK land should remain undeveloped in the long term. We did this to ascertain the overall levels of development that the UK public would find desirable and how those compare to the current levels of development in the UK.
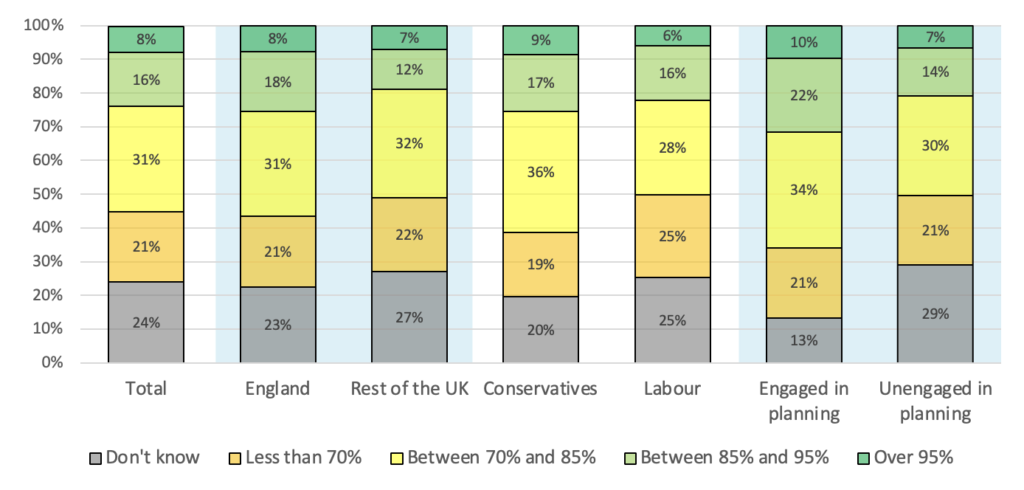
In general, the UK public seems to believe that the amount of land that is developed on in the UK should be far greater than it currently is. As illustrated in Chart 5 below, a plurality of the UK public (31%) thinks that between 70 and 85% of UK land should remain undeveloped in the long term. By comparison, currently in England – the country in the UK with the smallest proportion of undeveloped land – 91.1% of land is undeveloped. The implication of this is that a majority of the UK public (52%) think that the proportion of land that is undeveloped in the UK should be less than what it is. Only a small minority of 8% unequivocally think that the proportion of land in the UK that is undeveloped should be more than it is.
Chart 5. Views of the public on what proportion of UK land should remain undeveloped in the long term.
 Base: 2,243 UK adults.
There was very little variation among different socio-demographic groups regarding their responses to this question. A plurality of respondents in all tested groups said that between 70 and 85% of UK land should remain undeveloped in the long term. The greatest socio-demographic variation was between respondents from England and those from the rest of the UK, with respondents from England favouring slightly lower development levels; nonetheless, a plurality of respondents from both England (31%) and the rest of the UK (32%) favoured development levels of between 15 and 30%.
The chief difference between respondents engaged and unengaged with the planning system was the likelihood to answer ‘Don’t know,’ with that option being chosen by 29% of respondents unengaged with the planning system, but only 13% of those engaged with the planning system. A plurality of both groups favoured for between 70 and 85% of UK land to remain undeveloped, with 34% of those engaged with planning favouring this option, as compared to 30% of those unengaged with planning.
Variation was greater, but still small, between the voters of different parties. A plurality of the voters of all three major parties favoured for between 70% and 85% of UK land to remain undeveloped in the long term, with 36% of 2019 Conservative voters, 28% of 2019 Labour voters and 27% of 2019 Liberal Democrat voters choosing this option. Notably, Labour voters were around a third less likely to support over 95% of UK land remaining undeveloped in the long term as compared to 2019 Conservative voters.
Given the high levels of support for greater levels of development in the UK in general, we then went on to ask the UK public about the specific kinds of development that they would support.
Housing
First, we asked the UK public how much green housing – such as housing with exceptionally low carbon emissions and high energy and water efficiency – they want developed in their local areas. We did this to understand the desire for greater and greener housing development levels in the UK, as opposed to just development generally.
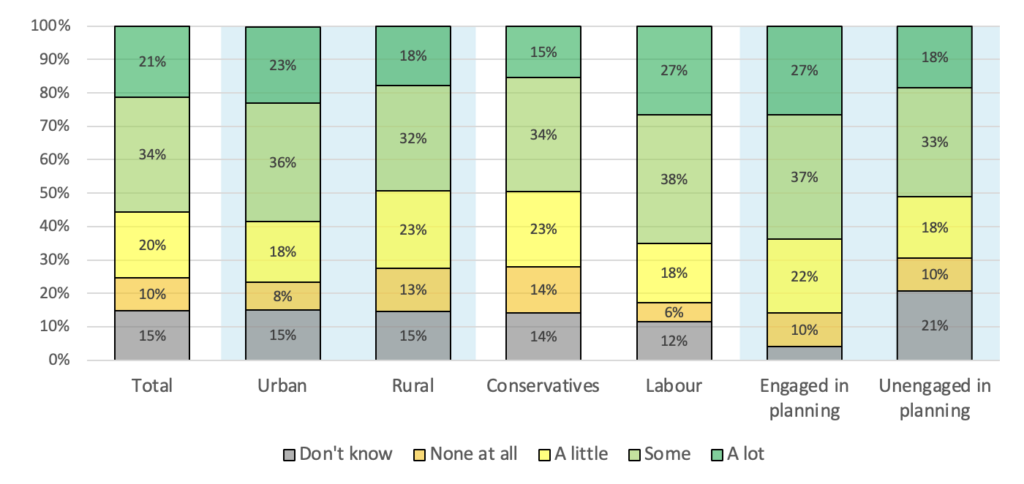
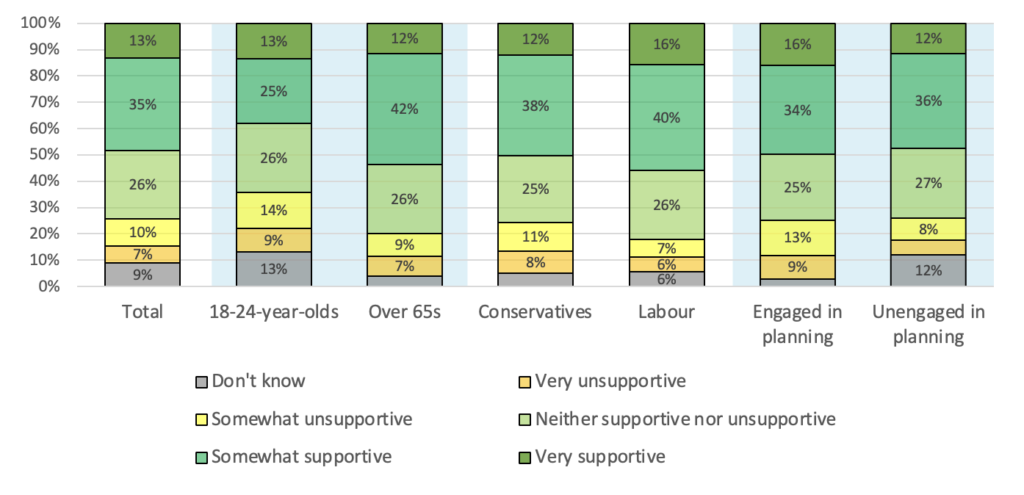
As can be seen in Chart 6 below, a strong majority of the UK public (75%) support a little (20%), some (34%) or a lot (21%) more green housing development in their local area. A small minority of 10% want none at all.
Chart 6. Views of the public on the development of more green housing in one’s local area.
 Base: 2,243 UK adults.
Responses varied slightly by age and, most prominently, local area. While all age groups were similarly likely to say that they want new green housing in their local area, older respondents were more likely to say that they want ‘none at all,’ with 13% of over 65s choosing that option as compared to only 8% of 18-to-24-year-olds.
Understandably, those living in urban areas were also more likely to support more new green housing in their local area than those living in rural areas. Again a majority of both groups wanted more of such housing, with 77% of respondents from urban areas and 73% of respondents in rural areas choosing that option, but respondents from urban areas were more likely to favour a lot of it; 23% of respondents from urban areas wanted a lot of new green housing in their local areas compared to 18% of respondents from rural areas, and only 9% of respondents from urban areas wanted no new green housing in their local area at all, as contrasted with 13% of respondents from rural areas.
Those engaged with the planning system were generally slightly more supportive of new green housing development in their local area. As with all other demographic variations, a majority of both those respondents engaged and unengaged with planning favoured new green housing development in their local area – 86% of those engaged and 69% of those unengaged – but, while only 18% of those unengaged with the planning system wanted a lot of it, the same was true for 27% of those engaged with the planning system, suggesting that green housing may command good support in the planning consenting process.
Finally, when it came to political variation, 2019 Conservative voters were far more likely to want less new green housing in their local area than the voters of other major parties. A majority of respondents among all political groupings wanted new green housing in their local area – 72% of Conservatives, 83% of Labour voters and 82% of Liberal Democrats – but, while 27% of Labour voters and 31% of Liberal Democrat voters wanted a lot of such housing, the same was true for only 15% of Conservative voters. Conversely, 14% of Conservative voters wanted no such housing at all; the same was true of only 6% of both Labour and Liberal Democrat supporters.
We then asked the UK public how much more likely they are to support a new housing development in their local area if the homes that form a part of it meet high environmental standards, such as if it has exceptionally low carbon emissions or high energy and water efficiency. We did this to understand whether high levels of support for new housing are to do with the housing being ‘green,’ or whether they are to do with support for new housing generally.
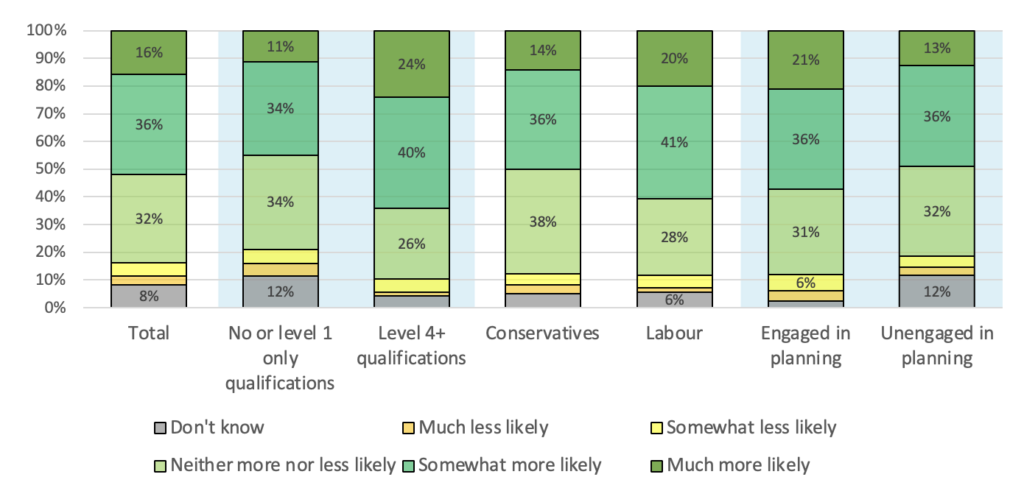
It is clear from the results that a housing development being more ‘green’ has a strong positive effect on the public’s level of support for it. A majority of the UK public (55%) was more likely – either ‘somewhat’ or ‘much more’ – to support new housing development in their local area if it meets a high environmental standard. Only a small minority of the UK public (8%) was less likely – either ‘somewhat’ or ‘much less’ – to support a new housing development on account of it.
Chart 7. Views of the public on whether one is more likely to support new housing development in one’s local area if it meets a high environmental standard.
 Base: 2,243 UK adults.
Again, there were some differences in responses between respondents from rural and urban areas. While a majority of respondents from urban areas (57%) said that they are net more likely to support a new housing development on account of it meeting a high environmental standard, only 49% of respondents from rural areas said the same. Moreover, while 24% of respondents from rural areas were ‘much more likely’ to support it, the same was true of only 14% of respondents from rural areas.
Also significant was variation between respondents with different income and education levels. A plurality of respondents educated to basic GCSE level or below (47%) said that they net more likely to support a new housing development on account of it meeting a high environmental standard, while a majority of university graduates (67%) said the same. University graduates were also over twice as likely to say they are much more likely to support such a development as compared with respondents educated to basic GCSE level or below; 31% of university graduates picked that answer, but only 15% of respondents educated to basic GCSE level or below did the same.
An analogous pattern followed for respondents on different incomes, with a majority of those in households earning over £40,000 a year (61%) being net more likely to support a new housing development on account of it meeting a high environmental standard, as compared to a plurality of those in households earning under £20,000 a year (43%).
Worth noting is that those engaged with the planning system were significantly more likely to find high environmental standards to be a cause for their support for a new housing development; again, a majority of those engaged with planning system (62%) was net more likely to support a new housing development on account of it meeting a high environmental standard, as was a majority of those unengaged in planning (51%), but, while only 18% of those unengaged in the planning system were much more likely to support a more environmentally-friendly development, the same was true for 26% of respondents engaged with planning.
Finally, as with the previous question, 2019 Conservative voters were again less enthusiastic about ‘green’ housing. A small majority of them (52%) was net more likely to support a new housing development on account of it meeting a high environmental standard, but a large majority of both Labour voters (66%) and Liberal Democrat voters (67%) was net more likely to support it. Of the respondents who were much more likely to support a new housing development on account of it meeting a high environmental standard, they were also less likely to vote Conservative than otherwise; only 17% of Conservative voters chose that option, as contrasted with 28% of Labour voters and 27% of Liberal Democrat voters.
Next, we asked a similar question, but regarding climate resilience; we asked the UK public how much more likely they are to support a local development if it is especially climate resilient – for example, if it was ensured that this development is resistant to flooding and that it protects those inside it from overheating. We did this to understand whether climate resilience is a priority for the UK public when it comes to new housing development.
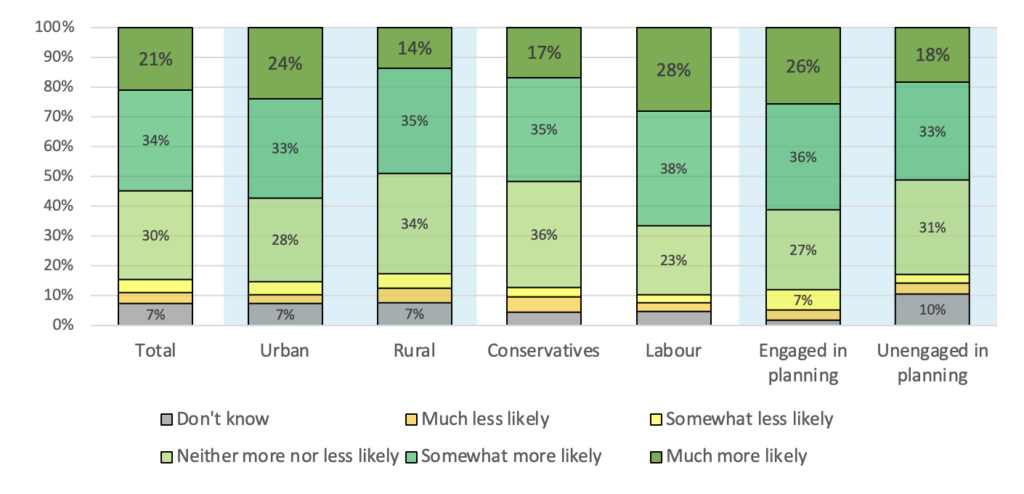
Once again, a similar story features – development being more climate resilient has a definite positive effect on the UK public’s level of support for it. A majority of the UK public (52%) was net more likely – either ‘somewhat’ or ‘much more’ – to support new development in their local area if it is especially climate resilient. Only a small minority of the UK public (8%) was less likely to support a new development on account of it. This is shown in Chart 8 below.
Chart 8. Views of the public on whether one is more likely to support new development in one’s local area if it is particularly climate resilient.
 Base: 2,243 UK adults.
As before, there were some differences between respondents with different income and education levels. A plurality of respondents educated to basic GCSE level or below (45%) said that they are net more less likely to support a new housing development on account of it particularly climate resilient, while a majority of university graduates (64%) said the same. University graduates were also over twice as likely to say they are much more likely to support such a development as compared with respondents educated to basic GCSE level or below; 24% of university graduates picked that answer, but only 11% of respondents educated to basic GCSE level or below did the same.
The pattern repeated also for respondents on different incomes, with a majority of those in households earning over £40,000 a year (60%) being net more likely to support new development on account of it being especially climate resilient; for those in households earning under £20,000 a year, this was only a plurality (49%). Twenty percent of respondents in households earning over £40,000 a year were also much more likely to support such a development; a view held by only 13% of respondents in households earning under £20,000 a year.
Those engaged with the planning system were again somewhat more likely to find climate resilience to be a cause for their support for a new development. A majority of those engaged with planning system (57%) was net more likely to support a new development on account of it being especially climate resilient, as was a plurality of those unengaged in planning (49%), but while only 13% of those unengaged in the planning system were much more likely to support a more climate resilient development, the same was true for 21% of respondents engaged with planning.
Finally, non-Conservative voters were more likely to favour climate resilience in development. A half of 2019 Conservative voters (50%) was net more likely to support a new development on account of it being especially climate resilient, but the same was true of 61% of Labour and 62% of Liberal Democrat voters.
Having established high levels of support for greener housing development, we asked the public to specify what pro-environmental adjustments they would most like to see in new developments in their local area. Respondents were able to pick any top two of the possible answers provided. We did this to narrow down whether any particular pro-environmental adjustments were more popular than others where it comes to planning consent.
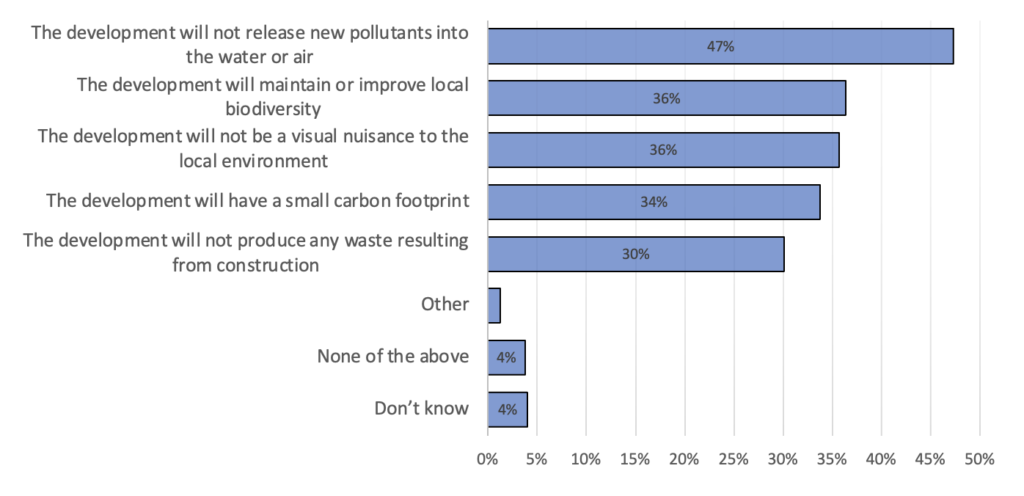
As can be seen in Chart 9 below, a plurality of the UK public (47%) thought that the development not releasing new pollutants into the water or air is one of the top two pro-environmental adjustments that would make them more supportive of new development in their local area. That said, the least popular pro-environmental adjustment – that the development will not produce any waste resulting from construction – was still a top-two adjustment for a large minority (30%) of the UK public.
Chart 9. Views of the public on the most popular pro-environmental adjustments for local development.
 Base: 2,243 UK adults.
There was no strong variation between the responses of the UK public with different socio-economic characteristics. The most significant variation came with age, with younger respondents generally more concerned with development having a small carbon footprint and slightly more concerned with local biodiversity; while a plurality of both 18-to-24-year-olds (49%) and over 65s (49%) agreed that not releasing new pollutants into the water or air is a desirable pro-environmental adjustment, also 42% of 18-to-24-year-olds held that view regarding the development having a small carbon footprint – as compared with 25% of over 65s – and regarding the development maintaining or improving local biodiversity – as compared with 32% of over 65s.
There was no significant variation at all between the responses of those engaged and unengaged in the planning system. A plurality of both groups said that not releasing new pollutants into the water or air an important adjustment, with 47% of those engaged in planning and 48% of those unengaged in planning holding that view.
The voters of different parties were also broadly in agreement on their responses to this question. A plurality of 2019 Conservative voters (44%) found not releasing new pollutants into the water or air an important adjustment, as did a plurality of 2019 Labour (49%) and a majority of 2019 Liberal Democrat (58%) voters. Their greatest disagreement was regarding the importance of the development having a small carbon footprint, with only 28% of 2019 Conservative voters picking that option, as contrasted with 35% of 2019 Labour and 41% of 2019 Liberal Democrat voters.
Infrastructure
Having explored the UK public’s views on the development of greater and greener housing, we asked about whether and how they would support the development of more low-carbon energy infrastructure.
First, we asked the public whether they support new onshore wind power development, and, if so, whether they do it regardless of where it takes place or only in certain areas. This question sought to ascertain the UK public’s level of support for onshore wind as compared to other types of development.
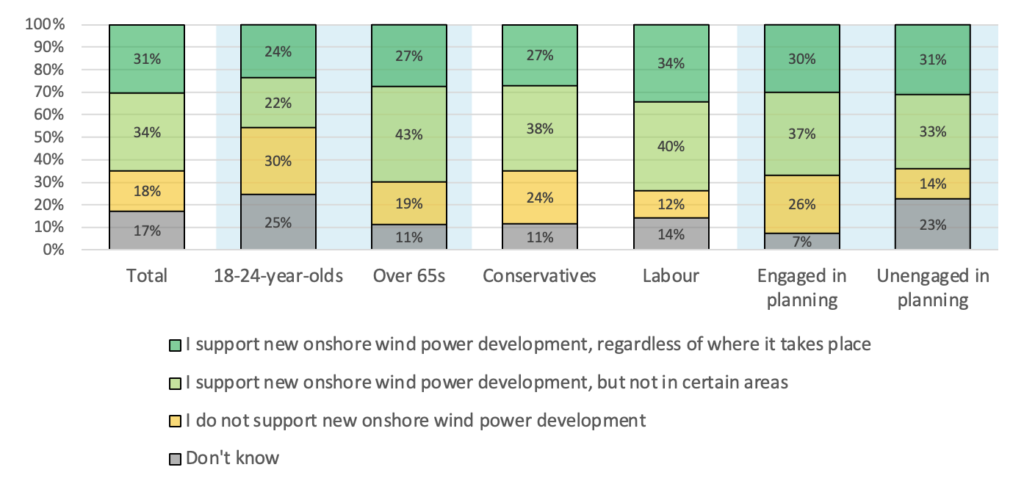
As can be seen in Chart 10 below, a majority of the UK public (65%) supported new onshore wind power developments. This is as compared to only 18% who do not. Of those who supported new onshore wind power development, they were almost evenly split on whether they support it unconditionally of its location (31% of the total UK public) or only in certain areas (34% of the total UK public).
Chart 10. Views of the public on the development of new onshore wind farms in the UK.
 Base: 2,243 UK adults.
There was some variation between responses from respondents of different ages, with younger respondents generally less supportive of new onshore wind power development. While a large majority of over 65s (70%) supported new onshore wind power developments, the same is true of only a plurality of 18-to-24-year-olds (46%). However, of those 18-to-24-year-olds supportive of new onshore wind power developments, 52% (24% of all 18-to-24-year-olds) supported them regardless of their location; the same can be said for only 39% (27% of all over 65s) of over 65s supportive of new onshore wind power developments.
Responses also varied slightly between respondents with different educational levels, with university graduates generally more supportive of onshore wind; a large majority of university graduates (74%) supported new onshore wind power developments, as compared to a smaller majority of respondents educated to basic GCSE level or below (56%).
Those who have historically engaged with the planning system were also more likely to be unsupportive of onshore wind – possibly caused by the fact that their opposition to an onshore wind development proposal is the reason why they are included in the category of ‘engaged with the planning system.’ While a majority of both those engaged (67%) and unengaged (64%) with the planning system supported the development of new onshore wind farms, those engaged with the planning system were almost twice as likely to be unsupportive of it, with 26% of them stating that as their response – this is as contrasted with only 14% of respondents unengaged with the planning system.
2019 Conservative voters were generally less supportive of onshore wind as compared to the voters of other parties: although new onshore wind power developments were supported by a majority of 2019 Conservative respondents (65%), the level of support was even higher among 2019 Labour (74%) and 2019 Liberal Democrat (79%) voters. Conservative voters were also twice as likely to oppose new onshore wind power developments, with 24% of them doing so, as compared to only 12% of 2019 Labour and 11% of 2019 Liberal Democrat voters.
As a follow-up to this question, we asked those who only support the development of onshore wind conditionally on its location which areas should not be used for onshore wind power development. We did this to find out what areas would be most suitable for such developments.
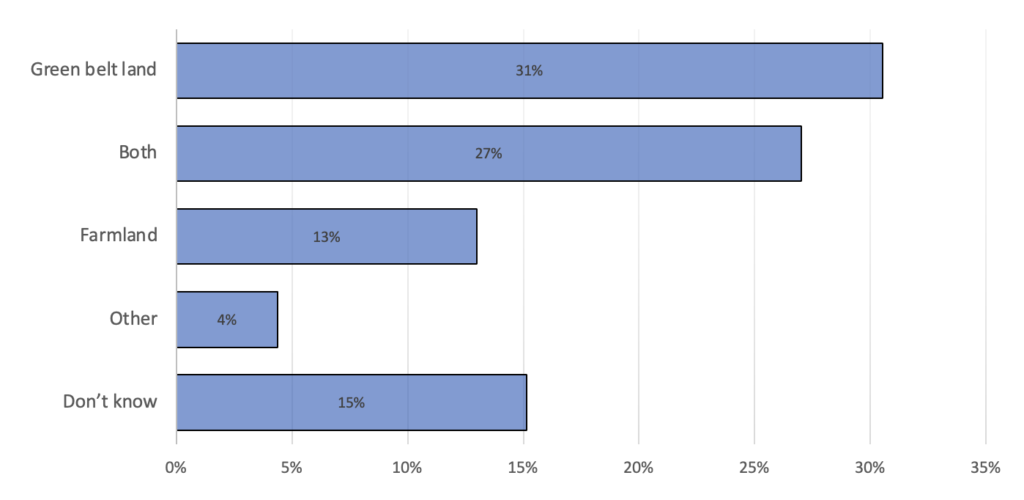
Of those who only support the development conditionally on its location, responses were divided as to what locations should be excluded. As can be seen in Chart 11 below, a majority of the UK public (58%) who only support onshore wind development in certain areas think that green belt land should be excluded from onshore wind development.
Chart 11. Views of the public on the areas that should not be used for onshore wind power development.
 Base: 766 UK adults who support onshore wind power development, but not in certain areas.
Due to the small sample size here, examining disparities in the responses to this question across other demographic divisions is impossible to conduct accurately.
We also asked a question about the planning process for onshore wind farms specifically; namely, whether it should be easier or harder to acquire planning permission to build onshore wind farms. The hope here was to draw out those who support onshore wind power provision more broadly but think that it is important to keep existing planning restrictions on its development.
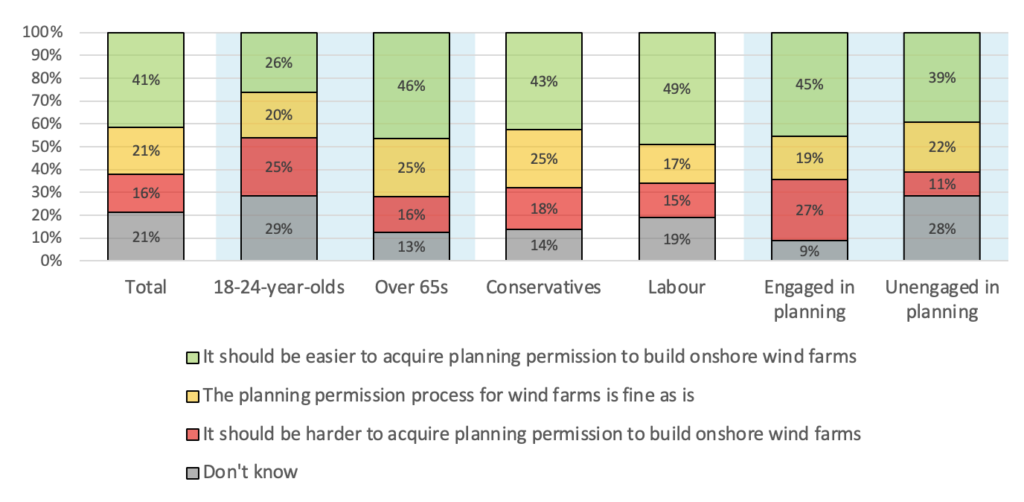
A plurality of respondents (41%) think that it should be easier to acquire planning permission to build onshore wind farms, as can be seen in Chart 12 below. In contrast, the response that ‘it should be harder to acquire planning permission to build onshore wind farms’ was the least common choice among respondents, with only 16% being of that opinion. Indeed, the view that ‘it should be easier to acquire planning permission to build onshore wind farms’ was the most popular choice among all groups for which we were able to test, except for some groups choosing ‘don’t know.’
Chart 12. Views of the public on the planning permission process for onshore wind farms.
 Base: 2,243 UK adults.
The most variation between responses to this question happened between different age groups, with younger people generally being less in favour of an easier planning process for onshore wind farms. A plurality of 18-to-24-year-olds (29%) did not know what their view on the planning permission process for onshore wind farms is. This is as contrasted with over 65s, of whom almost half (46%) thought that the planning permission process for onshore wind farms should be easier; indeed, only a small minority of over 65s (16%) thought it should be harder.
Those who have engaged with the planning system were generally more likely to think that the current planning permission process for onshore wind farms should be more difficult. A plurality of both those engaged (45%) and unengaged (39%) in planning thought that the process should be easier, however, a large minority of those engaged with the planning system (27%) thought that it should be harder; this is as compared to a small minority of 11% for those unengaged with the planning system.
Broadly, there was agreement between 2019 voters of the different political parties on the planning permission process for onshore wind farms. A plurality of both Conservative (43%) and Labour (49%) voters thought that it should be easier. Liberal Democrats were the most supportive of an easier planning permission process, with a majority of them (56%) picking that option.
Having discovered the UK public’s views on onshore wind development, we wanted to do the same for solar development. As such, we asked analogous questions – first, we asked the public whether they support new solar power development, and, if so, whether they do it regardless of where it takes place or only in certain areas.
As can be seen in Chart 13 below, a majority of the UK public (68%) supported new solar farm developments. This is as compared to only 15% who do not. Of those who supported new onshore wind power development, they were almost evenly split on whether they support it unconditionally of its location (33%) or only in certain areas (35%).
Chart 13. Views of the public on the development of new solar farms in the UK.
 Base: 2,243 UK adults.
There was some variation between responses from respondents of different ages, with younger respondents generally less supportive of new solar power development. While a large majority of over 65s (74%) supported new onshore wind power developments, the same is true of only a smaller majority of 18-to-24-year-olds (51%).
Responses also varied again between respondents with different educational levels, with university graduates generally more supportive of solar power; a very large majority of university graduates (76%) supported new solar farm developments, as compared to a smaller majority of respondents educated to basic GCSE level or below (59%).
Respondents on higher incomes were also more likely to be supportive of new solar farm developments. A large majority of those in households earning over £40,000 a year (72%) supported new solar power development, but the same is true of only 54% of those in households earning under £20,000 a year.
Those who have historically engaged with the planning system were more likely to be unsupportive of solar power. While a majority of both those engaged (67%) and unengaged (68%) with the planning system supported the development of new solar farms, those engaged with the planning system were over twice as likely to be unsupportive of it, with 24% of them stating that as their response – this is as contrasted with only 11% of respondents unengaged with the planning system.
There was broad agreement between the 2019 voters of different parties on the question of solar power, with a large majority of the voters of all major parties supporting new solar farm developments. Seventy-one percent of 2019 Conservative voters supported new solar power development, as did 76% of 2019 Labour voters and 81% of 2019 Liberal Democrat voters.
As a follow-up to this question, we asked those who only support the development of solar farms conditionally on their location which areas should not be used for solar power development. We did this to find out what areas would be most suitable for such developments.
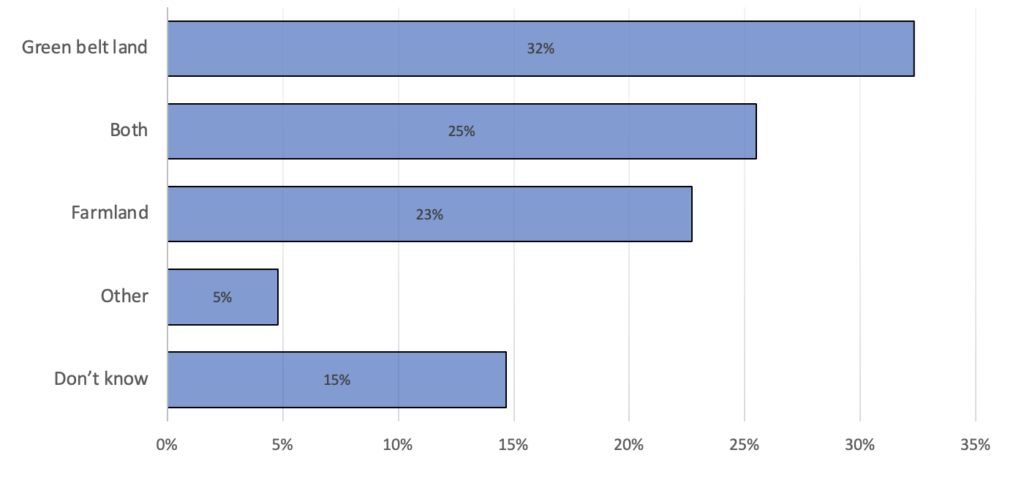
Responses to this question were very divided. Of those who support solar power development only in certain areas, a majority (57%) think that green belt land should be excluded from solar farm development, 48% think that farmland should be excluded and 25% think that both farmland and green belt land should be excluded.
Chart 14. Views of the public on the areas that should not be used for solar power development.
 Base: 778 UK adults who support solar power development, but not in certain areas.
Due to the small sample size here, examining disparities in the responses to this question across other demographic divisions is impossible to conduct accurately.
We also asked a question about the planning process for solar farms specifically; namely, whether it should be easier or harder to acquire planning permission to build solar farms. The hope here was to draw out those who support solar power provision more broadly but think that it is important to keep existing planning restrictions on its development.
A plurality of respondents (44%) think that it should be easier to acquire planning permission to build solar farms, as can be seen in Chart 15 below. In contrast, the response that ‘it should be harder to acquire planning permission to build solar farms’ was the least common choice among respondents, with only 16% being of that opinion. Indeed, the view that ‘it should be easier to acquire planning permission to build solar farms’ was the most common choice among all socio-economic and political groups for which we were able to test, echoing the findings for UK public attitudes towards planning permission for onshore wind development.
Chart 15. Views of the public on the planning permission process for solar farms.
 Base: 2,243 UK adults.
Again, the most variation between responses to this question happened between different age groups, with younger people generally being less in favour of an easier planning process for solar farms. While not as divided as on onshore wind, older people were again more likely to support an easier planning process for solar power, with a large plurality of over 65s (48%) saying that ‘it should be easier to acquire planning permission to build solar farms;’ this is as contrasted with a smaller plurality of 18-to-24-year-olds (32%).
Those who have engaged with the planning system were again more likely to think that the current planning permission process for solar farms should be more difficult. A plurality of both those engaged (46%) and unengaged (43%) in planning thought that the process should be easier, however, a large minority of those engaged with the planning system (26%) thought that it should be harder; this is as compared to a small minority of 11% for those unengaged with the planning system.
2019 Conservatives were slightly more likely to be supportive of a harder planning permission process for solar farms. While a plurality of 2019 Conservative voters (44%) said that the process should be easier, that view was held by a majority of both 2019 Labour (53%) and 2019 Liberal Democrat (56%) voters. Conversely, 19% of 2019 Conservatives thought that the process should be harder, as contrasted with only 12% of 2019 Labour and 13% of 2019 Liberal Democrat voters.
For our final question on developmental preferences, we wanted to understand the UK public’s preferences in regard to water use, and not just land use. Therefore, we outlined to the UK public that, sometimes, an area of English offshore waters is suitable for a range of different developments. We then asked which of the listed types of infrastructure government should prioritise when targeting English offshore waters for development.
As is visible in Chart 16 below, both solar and wind power were popular among UK respondents when competing for UK water space, and not just land. When given a choice between different development priorities for English offshore waters, a majority of the UK public (53%) believed that offshore wind farms should be a priority, and 41% believed that floating solar farms should be a priority: by far the two most popular respondents among UK respondents. By contrast, only 23% of respondents thought that oil and gas platforms should be a priority.
Chart 16. Views of the public on the development types that should be prioritised for English offshore waters.
 Base: 2,243 UK adults.
Again, responses to this question varied slightly between respondents of different ages. Most notably, older respondents were more enthusiastic about offshore wind, with a majority of over 65s (65%) choosing it as a development type that should be prioritised for English offshore waters. By contrast, only a plurality of 18-to-24-year-olds (34%) were of the same view.
Responses also did not vary significantly between the 2019 voters of different political parties. A majority of the voters of all major parties agreed that offshore wind farms should be a development priority for English offshore waters, with 59% of 2019 Conservative, 59% of 2019 Labour and 66% of 2019 Liberal Democrat voters acquiescing to that view. The most notable difference concerned views regarding oil and gas platforms; while 29% of 2019 Conservative voters thought they should be a priority, only 20% of 2019 Labour voters were of the same opinion.
Development concerns
Having established strong levels of support among the UK public for more housing and infrastructure development generally, we wanted to explore the reasons why one might nonetheless oppose – or at least have reservations regarding – such developments.
First, we asked the UK public about whether they have any concerns about developers in the UK building housing in a way such that it emits less carbon. Respondents could tick all options that apply. We did this to understand whether the public considers that the aims of greater and greener housing development conflict.
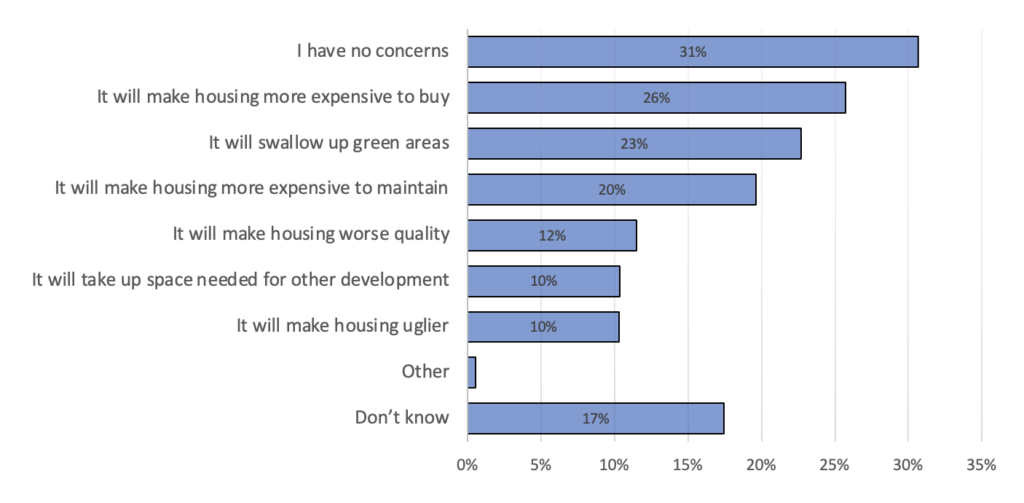
As shown in Chart 17 below, a plurality of the UK public (31%) had no concerns regarding developers building housing in a way such that it emits less carbon. Of those who did have at least one such concern, the most common concerns were that it will make housing more expensive to buy (26%) and that new such housing will swallow up green areas (23%).
Chart 17. Views of the public on developers building housing in a way such that it emits less carbon.
 Base: 2,243 UK adults.
Responses did not vary significantly between different socio-economic demographics except sex and, most prominently, age. Only 22% of 18-to-24-year-olds had no concerns regarding developers building housing in a way such that it emits less carbon; a plurality (27%), however, was concerned that it will make housing more expensive to buy. Conversely, 39% of over 65s had no concerns regarding developers building housing in a way such that it emits less carbon; the most common response of the options available among that age bracket.
Male respondents were also slightly less likely to have concerns regarding developers building housing in a way such that it emits less carbon, with 35% of them espousing that view as compared to only 26% of female respondents, although it was a plurality response for both sexes. Women (22%) were also much more likely than men (13%) to pick ‘Don’t know’ as their answer.
There were also some differences in the concerns had by people engaged and unengaged with the planning system. The most common response for both groups was to say that one has no concerns – a response given by 29% of those engaged and 32% of those unengaged – but those engaged with the planning system were significantly more likely to be concerned about environmentally-friendly housing swallowing up green areas (29 vs 19%), being uglier (17 vs 6%), taking up space needed for other development (17 vs 7%) and being worse quality (17 vs 8%).
Along party lines, there were no major discrepancies. The most common response among both 2019 Conservative (34%) and 2019 Labour (34%) voters was to say that one has no concerns. 2019 Liberal Democrat voters were slightly less likely to have no concerns (29%), a plurality of whom (29%) were concerned that building housing in a way such that it emits less carbon will make it more expensive to buy.
Second, we asked the UK public about whether they would be concerned about their neighbours making adjustments to their homes that reduce those homes’ carbon emissions. We did this to ascertain whether there would be significant opposition to relaxing the UK planning law on making such adjustments without having to seek planning permission.
The first such adjustment we asked about was heat pumps.
As can be seen in Chart 18 below, more of the UK public (33%) would either welcome – either ‘somewhat’ or ‘very’ – their neighbour installing a heat pump outside their home than have a net negative response to it (17%). However, a plurality of the public (41%) would have neither a positive nor a negative response.
Chart 18. Views of the public on an immediate neighbour installing a heat pump outside their home.
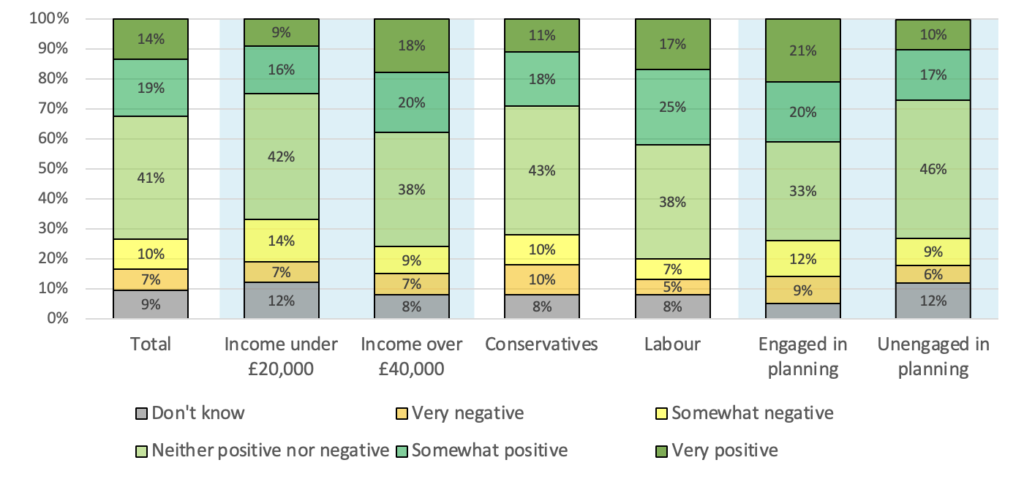 Base: 2,194 UK adults; those with no neighbours have been excluded.
The most consistent disparity between respondents of different socio-demographic characteristics was between lower- and higher-income respondents, with those in higher-income households generally having a more positive view of their neighbours installing heat pumps. A plurality of both respondents in households earning under £20,000 (42%) and households earning over £40,000 (38%) had neither a positive nor a negative view of an immediate neighbour installing a heat pump outside their home, but those in households earning over £40,000 were twice as likely to have a very positive view of it (18%) as those in households earning under £20,000 (9%).
Worth noting is that there was also again disparity between differently-aged respondents. While a plurality across all age brackets had neither a positive nor a negative view of an immediate neighbour installing a heat pump outside their home, respondents aged 18 to 24 were equally likely to have a net negative view of their neighbour installing a heat pump outside their home as to have a net positive view of it (26%). The age bracket that would respond most positively to their neighbour installing a heat pump outside their home, however, is middle-aged respondents, with those aged 45 to 54 being 25 percentage points more likely to have a net positive view of it (36%) than a negative one (11%).
There was only limited variation in responses between those historically engaged and unengaged in the planning process. A plurality of both those engaged (33%) and unengaged (46%) in planning had neither a positive nor a negative view of an immediate neighbour installing a heat pump outside their home. Most notably, those engaged in planning were over twice as likely to have a very positive view of an immediate neighbour installing a heat pump outside their home, with 21% of them holding that view as compared to only 10% of those unengaged in planning.
2019 Conservative voters were also slightly less likely to have a positive view of their neighbour installing a heat pump. Again, a plurality among the voters of all parties had neither a positive nor a negative view of an immediate neighbour installing a heat pump outside their home – 42% for 2019 Conservative voters, 37% for 2019 Labour voters and 38% for 2019 Liberal Democrat voters – but 2019 Conservative voters were more likely to have a net negative view of it than the voters of other major parties. Only nine percentage points more Conservatives had a net positive view of it as compared to 30 percentage points more Labour voters and 39 percentage points more Liberal Democrat voters.
Last, we asked the UK public how they would feel if their immediate neighbour installed solar panels on the roof of their home.
As can be seen in Chart 18 below, the UK public is even more positive about solar panels than heat pumps by their neighbours’ homes. A majority of the UK public (58%) would have a net positive – either ‘somewhat’ or ‘very – reaction to their neighbour installing solar panels. This is as opposed to only 8% who would have a net negative reaction.
Chart 19. Views of the public on an immediate neighbour installing solar panels on the roof of their home.
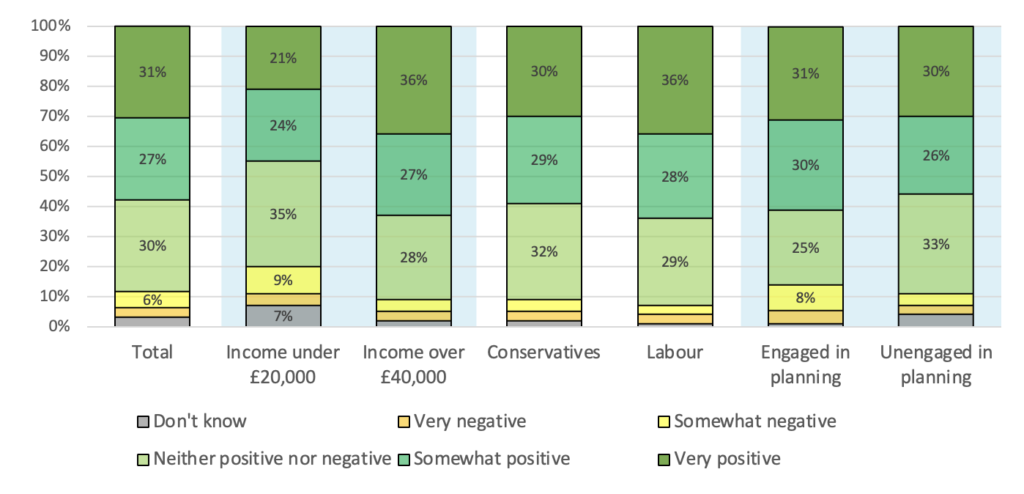 Base: 2,192 UK adults; those with no neighbours have been excluded.
The most consistent disparity between respondents of different socio-demographic characteristics was again between lower- and higher-income respondents, with those in higher-income households generally having a more positive view of their neighbours installing solar panels. While a majority of respondents in households earning over £40,000 (63%) had a net positive view of a neighbour installing solar panels, this was true of only a plurality of respondents in households earning under £20,000 (45%).
While there was also again disparity between differently aged respondents, this time it was modest. Overall, 50% of 18-to-24-year-olds had a net positive view of their neighbour installing solar panels, as compared to 62% of 45-to-54-year-olds – the age bracket most positive about solar panel instalment.
Among political voting groups, there was little variation. Although a plurality of 2019 Conservative voters (32%) said that they had neither a positive nor a negative view of an immediate neighbour installing solar panels on the roof of their home, it is also the case that only 7% of 2019 Conservative voters had a net negative view of it, while 59% of them had a net positive view. This is as compared to 64% of 2019 Labour voters having a net positive of the solar panel instalment; the most common response among 2019 Labour voters (36%) was to have a very positive view of it.
Again, there was only limited variation in responses between those historically engaged and unengaged in the planning process. A majority of both those engaged (61%) and unengaged (56%) in planning had a net positive view of the instalment.
Chapter Three: Policies for greater and greener development
Having asked about the UK public’s concerns and views on new development, we asked them on specific potential ways in which such development in the UK could be made both greater and greener. The intention behind this was to test the popularity and electoral potential of those policies in the UK. The policies we polled on have been inspired by the papers on greater and greener development published by Bright Blue over the last year, as aforementioned in the summary.
Densification
Densification of residential areas can carry significant environmental benefits over developing more sparse residential development – crucially because it reduces the level of transport emissions produced by the residents of said development. In more dense developments, residents are more likely to use public transport – which is generally a lot less polluting than private transportation – and live closer to where they work, go out and study.
As such, we first asked the UK public how supportive they would be of densifying their local street. We explained that this would happen by developing on abandoned or sparsely used land, the conversion of other developments into residential developments and converting lower density residential developments into higher density ones.
As can be seen in Chart 20 below, a plurality of the UK public was net supportive – either ‘very’ or ‘somewhat’ – of densification (35%).
Chart 20. Views of the public on densifying one’s local street.
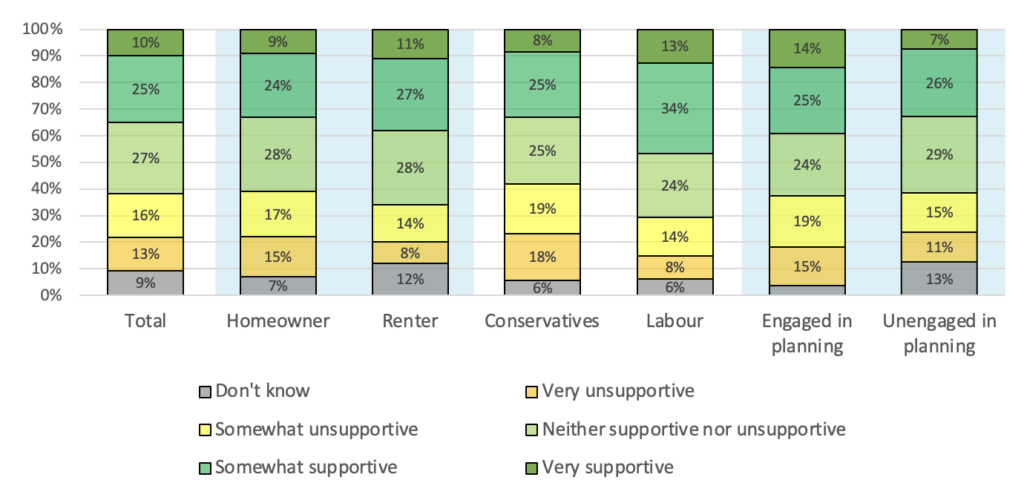 Base: 2,243 UK adults.
Responses to this question did not vary greatly between different socio-economic demographics. The most pronounced of them was between renters and homeowners, with renters generally more supportive of densification. A plurality of both renters (38%) and homeowners (33%) were net supportive of densification (28%), however, renters were less likely to be net unsupportive (22%) of densification than homeowners, 32% of whom were net unsupportive.
Of those engaged in the planning system, they had stronger opinions on the question than those unengaged, but they were generally not any more or less supportive of densification than their counterparts. A plurality of those engaged in the planning system (39%) were net supportive, as was a plurality of those unengaged with it (33%). However, those engaged in planning were more likely to both be very supportive (14%) and very unsupportive (15%) of densification in comparison to the unengaged, of whom only 7% were very supportive and 11% very unsupportive.
More pronounced was the difference between the responses of the 2019 voters of different political parties, with 2019 Conservative voters generally less supportive of densification than Labour voters. A minority of 2019 Conservatives were net supportive of densification (33%), while a plurality of 2019 Labour voters were (47%). Furthermore, 2019 Conservative voters were a lot more likely to be very unsupportive of it (18%) as compared to Labour voters (8%). Indeed, while a plurality of 2019 Conservatives were net unsupportive of densification (36%), the same was true for only 23% of 2019 Labour voters.
In policy terms, new development often requires a trade-off between either densification of already developed areas or more sparse development on previously undeveloped areas. To draw out which of those two the UK public prefers, we followed up the question on densification with a question on whether the respondent would prefer to develop new settlements in undeveloped nearby areas.
As Chart 21 below shows, the UK public generally prefers more sprawling but less dense developments to densification. A majority of the UK public (48%) was net supportive – either ‘very’ or ‘somewhat,’ as compared to only 17% of the UK public who are net unsupportive of it.
Chart 21. Views of the public on developing new settlements in undeveloped areas.
 Base: 2,243 UK adults.
There was only limited variation in responses from respondents with different socio-demographic characteristics. Most significantly, younger respondents were generally less supportive of new settlements. Only 38% of 18-to-24-year-olds were net supportive of new developments, as compared to 54% of over 65s. This can perhaps be explained by the fact that older respondents can remember the development of the English ‘new towns’ – such as Stevenage in the 1940s and Milton Keynes in the 1960s – and think of it as successful.
Curiously, respondents identifying as Black or Asian were also much more likely to be supportive of the development of new settlements. Among Black respondents, 66% were net supportive of new settlements, as compared to 59% of Asian and 47% of white respondents, and among Asian respondents, only 8% were net unsupportive of new settlements – very few in comparison to the 15% of Black respondents and 17% of white respondents who were net unsupportive.
Politically, there was only limited variation between responses. Either half or a small majority of the voters of all major parties was net supportive of new settlements, with 50% of Conservative, 56% of Labour and 54% of Liberal Democrat voters being of that view. Labour voters were slightly less likely to be net unsupportive of new settlements, however, with only 12% being of that persuasion, as compared to 19% among Conservatives.
There was no notable variation in responses between those with different levels of engagement in the planning system. Among those engaged with the planning system, half (50%) was net supportive of new settlements, while a large plurality (48%) of those unengaged were of the same view.
Subsidising planning authorities
Currently, the operation of planning processes for renewable energy developments is often needlessly delayed because of the amount of time it takes for planning applications for such developments to be produced, submitted and approved. The process could be radically sped up if local planning authorities proactively planned for such developments instead.
As such, we asked the UK public whether local planning authorities should be rewarded by central government in exchange for proactive planning for more renewable energy infrastructure developments, such as wind and solar. As with all questions in this section of this polling analysis, the hope was to establish public levels of support for this specific policy.
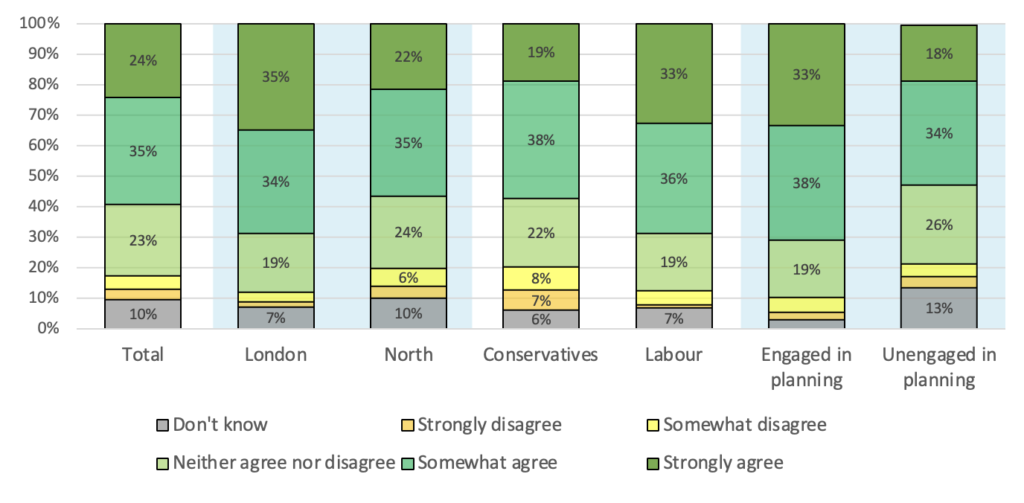
The policy is very popular with the UK public, a majority of which (59%) agreed with it either ‘somewhat’ or ‘strongly,’ as can be seen in Chart 22 below.
Chart 22. Views of the public on whether local planning authorities should be rewarded by central government in exchange for proactive planning for more renewable energy infrastructure developments.
 Base: 2,243 UK adults.
Although the policy was supported by a majority across all socio-economic groups, it was noticeably more popular in London than in the North of England. While a very large majority of London respondents agreed with the policy (69%), the same was only true of 57% of respondents from the North. Northern respondents were also more likely to disagree with the policy; 10% of them did so, in contrast to only 5% of Londoners.
Unsurprisingly, the policy was also very popular among those engaged with the planning system. A vast majority of them (71%) were in agreement with it, as was a small majority of those unengaged with planning (52%). Moreover, those engaged with the planning system were much more likely to strongly agree with the policy. Thirty-three percent of those engaged with planning strongly agreed, while only 18% of those unengaged did the same.
Again, although the policy was supported by a net majority across the voters of all political parties, it was relatively less popular among Conservative voters. A majority of the voters of all major political parties agreed with the policy – 57% of Conservatives, 69% of Labour voters and 74% of Liberal Democrat voters. Furthermore, 14% of Conservatives net disagreed with the policy – far more than the 6% of Labour and the 2% of Liberal Democrat voters.
Mandatory community benefits
Community benefits – funds or assets to communities that host or are affected by the new development – being voluntary can be troublesome, as infrastructure developers can compete on costs between each other on the level of community benefits or use community benefits to ‘bribe’ the most reluctant communities, encouraging communities to be as reluctant to new developments as possible. Those problems could be avoided by institutionalising a mandatory minimum level of community benefits. As such, we explained to respondents what community benefits are and asked them how important it would be for community benefits to be offered if a new onshore wind turbine was proposed near their community. We asked respondents to assume that the wind turbine would be 200 metres tall, with a 100-metre blade diameter, as this is roughly what an average onshore wind turbine measures.
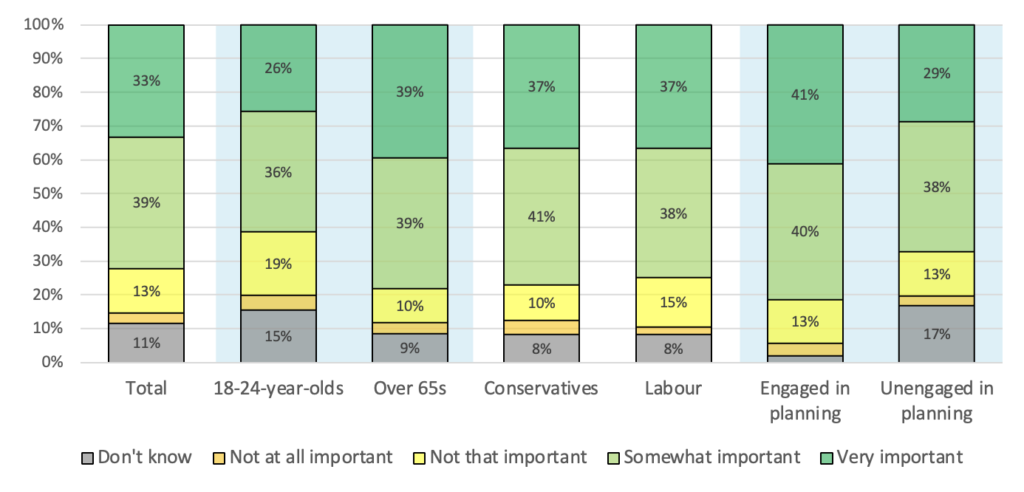
Chart 23 below shows that an overwhelming majority of the UK public (72%) considered community benefits either ‘somewhat’ or ‘very’ important when an onshore wind turbine is proposed near their local community.
Chart 23. Views of the public on the importance of community benefits for when an onshore wind turbine is proposed near one’s local community.
 Base: 2,243 UK adults.
There was only limited variation in responses from respondents with different socio-demographic characteristics. Most notably, older respondents were slightly more enthusiastic about the importance of community benefits; while a majority of 18-to-24-year-olds (62%) found community benefits to be net important, over 65s were overwhelmingly of that opinion (78%). Over 65s were also almost half as likely to find community benefits not that important – only 10% of them believed so, as compared to 19% of 18-to-24-year-olds.
Those engaged with the planning system were more enthusiastic about community benefits than their counterparts, with a very strong majority (81%) of those engaged in the planning system finding community benefits to be net important – a position held by only 67% of those unengaged in the planning system.
Finally, politically, there is almost a consensus between the 2019 voters of different political parties on this question. A big majority among the respondents from all major parties found community benefits to be net important, with 78% of Conservatives, 75% of Labour voters and 79% of Liberal Democrats being of that view.
Having established the important of community benefits in the context of onshore wind developments, we asked the same question regarding solar power. We asked respondents to answer how important it would be for community benefits to be offered if a new solar power farm was proposed near their community. We asked respondents to assume that the farm would take up seven acres of land.
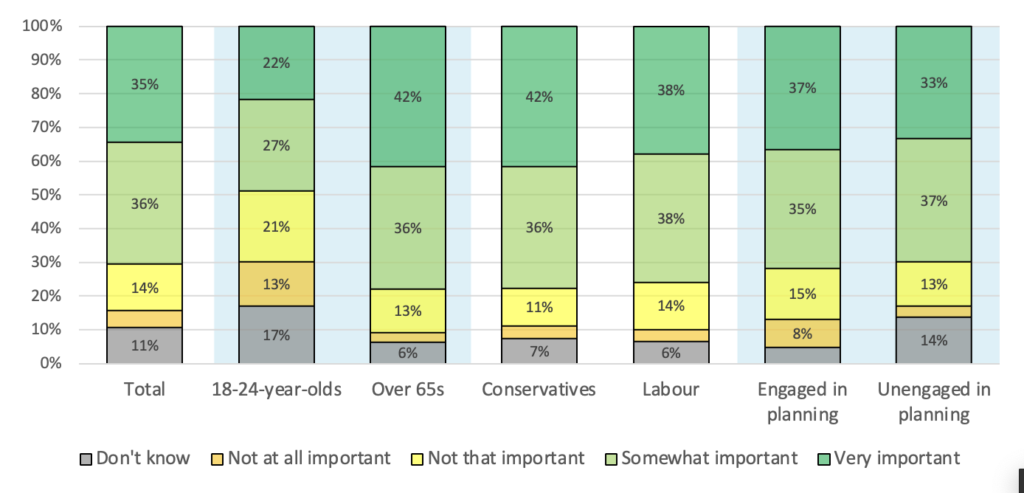
Community benefits continued to be important in the context of solar power. Chart 24 below shows that a majority of the UK public (71%) considered community benefits net important – either ‘somewhat’ or ‘very – when a solar power farm is proposed near their local community.
Chart 24. Views of the public on the importance of community benefits for when a solar power farm is proposed near one’s local community.
 Base: 2,243 UK adults.
There was more pronounced variation in responses from respondents from different age groups, with younger people generally finding community benefits to be less important. While a very large majority of over 65s (78%) found them to be net important, only a plurality of 18-to-24-year-olds (49%) agreed. Moreover, 21% of 18-to-24-year-olds found them to be not that important, as contrasted with only 13% of over 65s, and 13% of 18-to-24-year-olds found them to be not at all important, as contrasted with only 3% of over 65s.
With this question, different levels of engagement in the planning system did not correlate with significant disparity in question answers. A majority of those engaged in planning (72%) found community benefits to be net important, as did 70% of those unengaged in planning.
Politically, there is again almost a consensus between the 2019 voters of different political parties on this question. 2019 Conservatives were marginally more enthusiastic about community benefits, with a majority of them (78%) finding them net important, as did 76% of Labour voters and Liberal Democrats.
Having established that the UK public generally find community benefits to be important when new renewable power infrastructure is being constructed near their community, we wanted to understand what it is specifically that the UK public want from community benefits. As such, we asked them about the kind of community benefits that they would find most desirable when consenting to a new onshore wind or solar power farm.
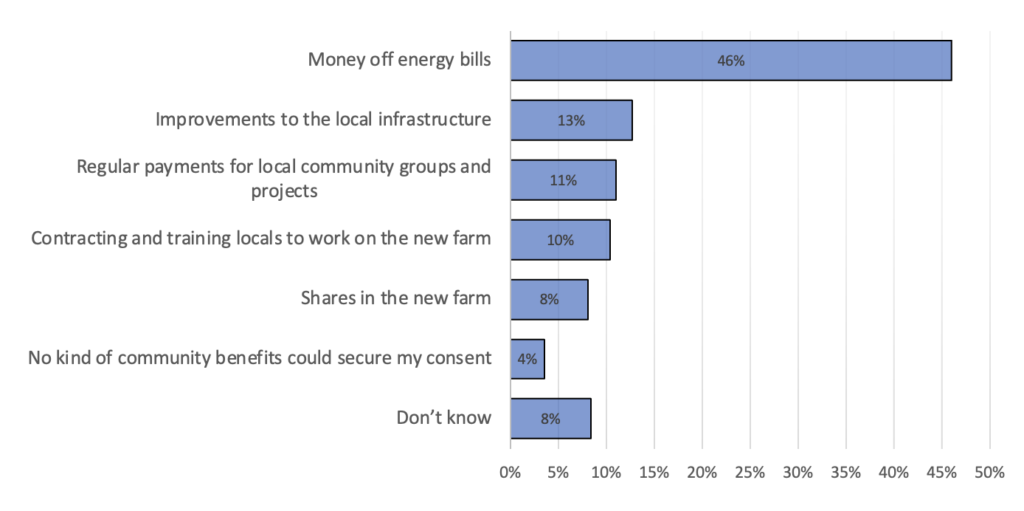
As can be seen in Chart 25 below, the overwhelming preference among respondents is for money off energy bills, chosen by a plurality of the public (46%). This option was over three times more popular than the second-most popular choice, which was improvements to local infrastructure, chosen by 13% of respondents.
Chart 25. Views of the public on the most desirable kind of community benefits when consenting to a new onshore wind or solar power development.
 Base: 2,243 UK adults.
Money off energy bills were particularly favoured among older respondents. A majority of over 65s (54%) chose this option, as compared to a plurality of 18-to-24-year-olds (27%). Interestingly, this option was roughly equally popular among all levels of household income, with between 45% and 47% of all income brackets choosing it.
Those engaged in planning were somewhat less likely to favour money off energy bills, as compared to the rest of the public; it was an option chosen by a plurality of them (37%), as compared to a majority of those unengaged in planning (52%).
Politically, there was broad agreement on the most desirable community benefits. A small majority of 2019 Conservative voters (52%) favoured money off energy bills, as did large Labour (46%) and Liberal Democrat (44%) pluralities.
Community support for onshore wind
One of the key reasons why the development of onshore wind turbines in England and Wales is more limited, as compared to offshore wind turbines in particular, is because of the so-called ‘triple veto’ policy: proposals for onshore wind development have to be located in an identified spatial zone, impacts have to be appropriately addressed and proposals have to demonstrate community support.
We, therefore, wanted to ask the UK public whether they would support abolishing a facet of the ‘triple veto’ policy – in particular, the facet most relevant to public support, namely community support. As such, we asked the public whether they think that the support of the local community should be needed in order to build new onshore wind turbines. We did this after explaining that, currently, in England, in order to build onshore wind turbines, the developer must demonstrate that their proposals have the support of the affected local community.
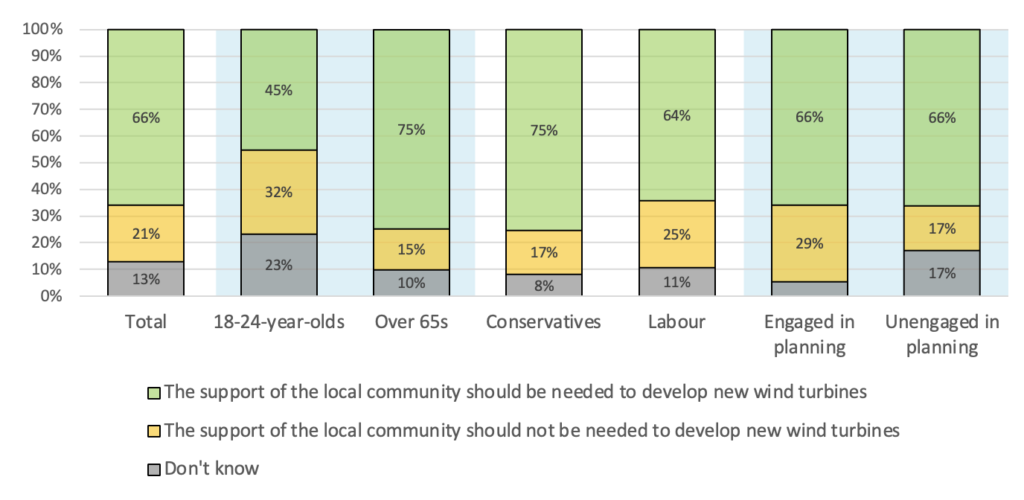
A majority of the UK public (66%) thought that the support of the local community should be needed to develop new wind turbines.
Chart 26. Views of the public on whether the support of the local community should be needed to develop new onshore wind turbines.
 Base: 2,243 UK adults.
Of all demographic divisions, 18-to-24-year-olds were the only one where ‘the support of the local community should be needed to develop new wind turbines’ was chosen by a plurality, instead of a majority, of respondents, with 45% of 18-to-24-year-olds choosing that option. Conversely, older respondents were even more likely to emphasise the importance of community consent than the average member of the public, with 75% of over 65s thinking the support of the community should be mandatory.
Although an equal majority of both those engaged and unengaged with the planning system (66%) thought that the support of the local community should be needed to develop new wind turbines, a greater proportion of those engaged in planning (29%) thought that it should not be needed, as compared to those unengaged (17%).
Politically, a majority of the 2019 voters of all major parties agreed that the support of the local community should be needed to develop new wind turbines. That said, 2019 Conservatives were slightly more likely to hold that view, with 75% of them saying so, as compared to 64% of 2019 Labour and 68% of 2019 Liberal Democrat voters. 2019 Labour voters were the most likely to say that the support of the community should not be needed, with 25% of them choosing that response.
Community power
Given the emphasis on the importance of community decision-making over housing and infrastructure development demonstrated by our research thus far, it becomes clear that policies intending to facilitate greater and greener development levels need to bring the community local to the development onboard. One way to do it is for the community to be directly involved in bringing forward the development.
As such, our next question asked respondents to imagine that the government gave local communities the power and funding to bring forward their own development proposals, which would get around the need for developers to come forward with development proposals; a developer would then be able to move forward according to the proposal of the community. We then polled them on how likely they would be to participate in creating such a proposal for their local area.
As can be seen in Chart 27 below, a plurality of respondents (33%) was net unlikely – either ‘somewhat’ or ‘very unlikely’ – to participate in creating a community-led development proposal for their local area. More of the public reported to be net unlikely to participate rather than net likely (25%). Indeed, the least common response to the question was ‘very likely,’ chosen by only 8% of respondents.
Chart 27. Views of the public on whether one would participate in creating community-led local plans for their area.
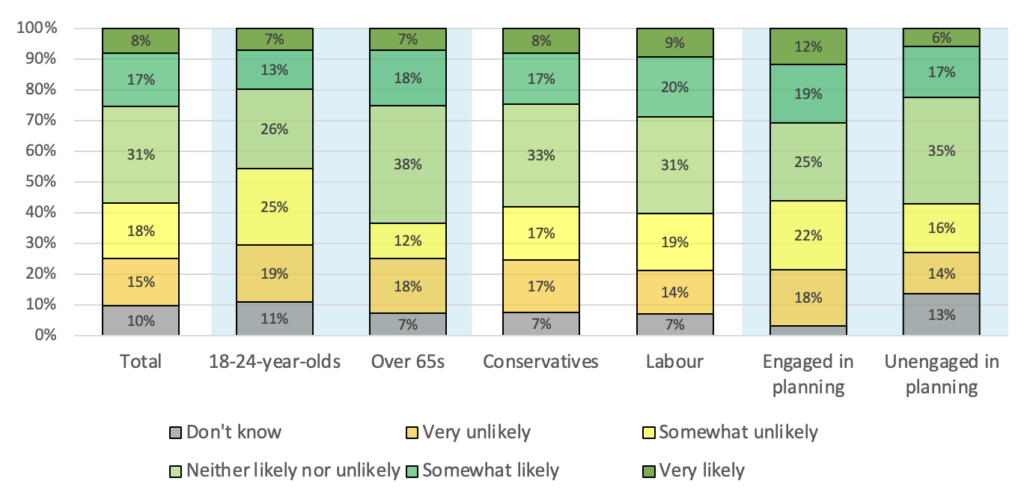 Base: 2,243 UK adults.
Of all socio-economic divisions, age was again the most pronounced. Young people were generally less likely to want to participate in the plans. While a significant proportion of respondents across all age groups reported to be neither likely nor unlikely to participate in them – 26% of 18-to-24-year-olds, with the proportion increasing steadily with age, peaking at 38% of over 65s – a plurality of 18-to-24-year-olds (43%) said that they would be net unlikely to participate in creating community-led local plans for their area. This is as compared to only 29% of over 65s, of whom a plurality was neither likely nor unlikely to participate.
On different levels of engagement with the planning system, those engaged were again more decisive. A plurality of both those engaged and unengaged considered themselves to be neither likely nor unlikely to participate in creating community-led local plans for their area, with 25% of those engaged and 35% of those unengaged reporting so. However, those engaged in planning were more likely to report every other option besides ‘Don’t know.’
The biggest divide, however, was political. As with most demographic groupings, a plurality of the 2019 voters of all parties considered themselves to be neither likely nor unlikely to participate in creating community-led local plans for their area – 33% of Conservatives, 31% of Labour voters and 31% of Liberal Democrats. However, supporters of the Liberal Democrats were the only demographic grouping that considered themselves more likely to participate than not, with a plurality of Liberal Democrat voters (41%) considering themselves net likely, and only 23% considering themselves net unlikely. At the same time, only 25% of 2019 Conservative voters and 29% of 2019 Labour voters considered themselves net likely, while 35% of Conservatives considered themselves net unlikely, as did 33% of Labour voters. This means that Conservative voters were ten percentage points less likely than otherwise to participate, while Liberal Democrats were 18 percentage points more likely than otherwise.
Having established the level of enthusiasm for community-led local development plans, we wanted to explore the potential of community-led energy provision as well. As such, we asked the UK public about whether they would be likely to join a community energy group. We explained that a community energy group is a group of locals who develop and own small-scale renewable energy infrastructure, such as small wind turbine, to lower the local community’s energy bills. To do this, they receive help from local government and can access some government funds.
As visible in Chart 28 below, the public was divided on this question, with a plurality of respondents (45%) saying that they would be net likely – having chosen either ‘likely,’ ‘very likely,’ or ‘already belong to one’ – to join a community energy group. That said, other responses were also chosen by large minorities of respondents – 41% said that they would be net unlikely – either ‘unlikely’ or ‘not at all likely.’ It is worth mentioning that 2% of respondents claimed to already belong to a community energy group, so they are included as ‘net likely’ to join such a group, with the probability of it being 1.
Chart 28. Views of the public on one’s likelihood in joining a community energy group.
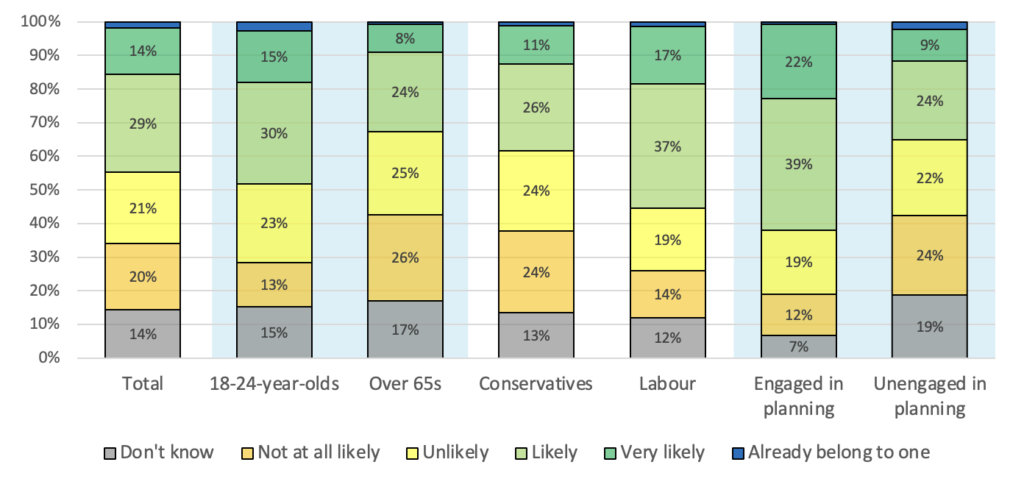 Base: 2,243 UK adults.
Once again, age was the most significant socio-economic divide, with younger people generally more likely to join a community energy group than older respondents. Overall, 48% of 18-to-24-year-olds were net likely to join a community energy group, as compared to only 33% of over 65s. Fifty-one percent of over 65s were net unlikely, but only 39% of 18-to-24-year-olds were of the same view.
Moreover, those from ethnic minority backgrounds were more likely to join a community energy group. Sixty-four percent of those who identified themselves as Black or Asian considered themselves net likely to join a community energy group, as compared with only 42% of those identifying as white. Those identifying as white are more unlikely to join a community energy group than otherwise, as 43% of them said they would be net unlikely to join one.
Those engaged with the planning system were particularly likely to join a community energy group. A majority of those engaged in planning (62%) were net likely to join, suggesting that community energy projects stand a good chance at a smoother planning consenting process; the same was true for only 35% of the unengaged.
Politically, 2019 Conservative voters were the least enthusiastic about community energy groups. Thirty-eight percent of Conservatives were net likely to join a community energy group and 48% were net unlikely. By comparison, 55% of Labour voters were net likely to join but only 31% were net unlikely.
Planning permissibility for solar
Given the competing demands for land use and the potential to generate a lot of power through small-scale solar development mounted on the roofs of existing buildings, we also wanted to ask the public on how supportive they would be of mandating that a greater proportion of new and existing buildings have solar panels fitted to them.
As can be seen in Chart 29 below, a strong majority of the UK public (65%) would be net supportive – either ‘very’ or ‘somewhat’ – of mandating that a greater proportion of buildings have solar panels fitted to them, with only a small minority (9%) net unsupportive.
Chart 29. Views of the public on mandating that a greater proportion of buildings have solar panels fitted to them.
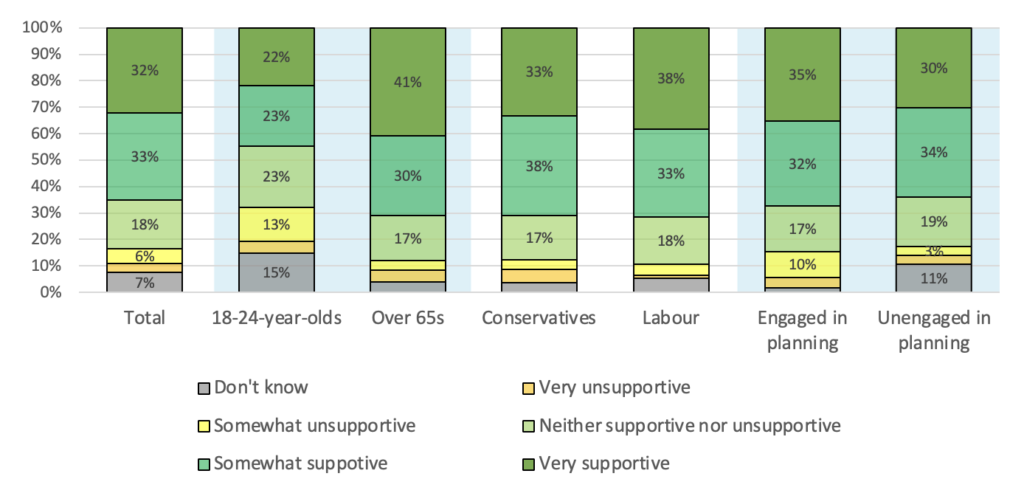 Base: 2,243 UK adults.
Young people were generally less supportive of the policy. A plurality of 18-to-24-year-olds (45%) were net supportive of mandating that a greater proportion of buildings have solar panels fitted to them, as compared to 71% of over 65s.
Worth noting is also that those on lower incomes were slightly less likely to support the policy than those in other income groups. A small majority of those with a household income of under £20,000 (51%) were net supportive of the policy, as compared to 68% of those with household incomes of between £20,000 and £40,000 and 70% of those with household incomes of over £40,000.
There was only small variation in responses between those engaged and unengaged in the planning system. A majority of both groups was net supportive, with 67% of the engaged and 64% of the unengaged being so.
The policy commanded bipartisan support, with over 71% of both Conservative and Labour voters net supporting it. The policy was most popular among Liberal Democrats, with 74% being net supportive.
Conclusion
This analysis revealed 15 main findings on UK public attitudes about the importance of and potential policies for greater and greener housing and infrastructure development levels in the UK:
Climate risks
- A plurality of the UK public was not too concerned about their home’s ability to withstand future climate-related emergencies. Younger people were generally more concerned about their home’s ability to withstand future climate-related emergencies, as were those who have engaged in the planning system in the past. Conversely, those who have voted Conservative in the 2019 general election were relatively less likely to be concerned with the climate resilience of their home.
- Half of the UK public said the climate risk they are most concerned about is extreme weather events, such as storms, for their own home and neighbourhood. Younger people were notably less concerned about extreme weather events and water scarcity, as compared to older respondents. A majority of over 65s mentioned extreme weather events as one of their top concerns, as contrasted to only a minority of 18-to-24-year-olds. Different 2019 voters, however, were all concerned most about extreme weather events such as storms.
- A large plurality of the UK public had no flood resilience measures introduced to their home or local area, as far as they were aware. Younger people showed a far greater awareness of the existence of flood resilience measures; only a small minority of 18-to-24-year-olds claimed to be aware of no flood resilience measures in their home or local area. On the other hand, the overwhelming majority of over 65s were not aware of any flood resilience measures in their home or local area. Those engaged in the planning system also showed a much greater awareness of the existence of flood resilience measures protecting their home or their local area.
Housing and infrastructure development
- A plurality of the UK public thought that between 70 and 85% of UK land should remain undeveloped in the long term. Moreover, a majority of the UK public (52%) thought that the proportion of land that is undeveloped in the UK should be less than what it is. There was very little variation between different socio-demographic groups on the answers to this question.
- An overwhelming majority of the UK public supported more green housing – such as housing with exceptionally low carbon emissions and high energy and water efficiency – being developed in their local area. A majority of respondents among all 2019 voters wanted new green housing in their local area, but 2019 Conservative voters were more likely to want no or less of such housing. Younger people, and those living in urban areas, however, were the keenest on it.
- A majority of the UK public say they support new housing development in their local area if it meets high environmental standards. Conservative voters were generally less enthusiastic about ‘green’ housing, as were respondents from rural areas and those with a lower educational level. Notably, those who have engaged with the planning system were very likely to find housing meeting a high environmental standard a cause for supporting it.
- A majority of the UK public claim that they are more likely to support a new development in their local area if it is particularly climate resilient. This was especially true of those with a higher education level. A plurality of respondents educated to basic GCSE level or below said that they are more likely to support a new housing development on account of it particularly climate resilient, while a majority of university graduates said the same. Again, those who have engaged with the planning system were exceptionally likely to find housing climate resilience a cause for support for a development.
- A plurality of the UK public thought that the development not releasing new pollutants into the water or air is one of the top two pro-environmental adjustments that would make them more supportive of new development in their local area. The most significant variation in responses to this question came with age, with younger respondents generally more concerned with development having a small carbon footprint and slightly more concerned with local biodiversity.
- A large majority of the UK public support new onshore wind power development, either unconditionally of its location or only in certain areas. However, interestingly, young people were less likely to do so. While a large majority of over 65s support new onshore wind power developments, either unconditionally or only in certain areas, the same is true of only a plurality of 18-to-24-year-olds. And although 2019 Conservative voters were also less likely to support it than the 2019 voters of other parties, they were still far more likely to support it than not.
- A majority of the UK public who only support onshore wind development in certain areas think that green belt land should be excluded from onshore wind development. Almost half believed that farmland should be excluded, and a minority believed that both farmland and green belt land should be excluded.
- A plurality of the UK public think it should be easier to acquire planning permission to build onshore wind farms. This was especially true for older respondents. Almost half of over 65s thought that the planning permission process for onshore wind farms should be easier. A plurality of the voters of all major political parties in 2019 agreed it should be easier.
- A majority of the UK public support the development of new solar farms, either unconditionally of its location or only in certain areas. Younger respondents were generally less supportive of new solar power development. While a very large majority of over 65s support new onshore wind power developments, unconditionally or only in certain areas, the same is true of only a smaller majority of 18-to-24-year-olds. A majority of 2019 voters of all parties also agreed with the development of solar farm, either unconditionally or only in certain areas.
- Of those who support solar power development only in certain areas, a majority thought that green belt land should be excluded from solar farm development. Almost half believed that farmland should be excluded, and a quarter believed that both farmland and green belt land should be excluded.
- A plurality of the UK public believe that it should be easier to acquire planning permission to build solar farms. However, younger people were generally less in favour of an easier planning process for solar farms. While not as divided as on onshore wind, older people were again more likely to support an easier planning process for solar power, with a large plurality of over 65s saying that it should be easier to acquire planning permission to build solar farms; this is as contrasted with a smaller plurality of 18-to-24-year-olds.
- When given a choice between different development priorities for English offshore waters, a majority of UK public believe that offshore wind farms should be a priority. Most notably, older respondents were more enthusiastic about offshore wind, with a majority of over 65s choosing it as a development type that should be prioritised for English offshore waters. By contrast, only a plurality of 18-to-24-year-olds were of the same view. Floating solar farms were also a popular option. Oil and gas platforms, on the other hand, were preferred by only a small minority of the UK public.
- A plurality of the UK public had no concerns regarding developers building housing in a way such that it emits less carbon. Men and younger people were less likely to have no concerns regarding it, with a plurality of younger people concerned that it would make housing more expensive to buy. Those engaged with the planning system were more likely to have concerns in general.
- A plurality of the public would have neither a positive nor a negative response to their neighbour installing a heat pump outside their home. Those in better-earning households were more likely to have a more positive view of it, as were middle-aged respondents.
- A majority of the UK public would have a positive reaction to their neighbour installing solar panels on the roof of their home. Again, those in better-earning households were more likely to have a more positive view of it, as were middle-aged respondents.
Policies for greater and greener development
- A plurality of the UK public was supportive of densifying their local street. Renters were generally more supportive of densification than homeowners; conversely, those who voted for the Conservative Party in 2019 were generally less supportive of it. Those historically engaged in the planning system had generally stronger opinions in their answers, but were not any more or less supportive of densification than their counterparts. A plurality of both renters (38%) and homeowners (33%) were net supportive of densification (28%), however, renters were less likely to be net unsupportive (22%) of densification than homeowners, 32% of whom were net unsupportive.
- A majority of the UK public was supportive of developing new settlements in undeveloped nearby areas. Younger respondents were generally less supportive of new settlements. Conversely, respondents identifying as Black or Asian were much more likely to be supportive of the development of new settlements. There was broad consensus among the different political groups on this question.
- A majority of the UK public believe that local planning authorities should be rewarded by central government in exchange for proactive planning for more renewable energy infrastructure developments, such as onshore wind and solar power. Although the policy was supported by a net majority across the 2019 voters of all political parties, it was relatively less popular among 2019 Conservative voters. It commanded overwhelming support in London and, unsurprisingly, among those engaged with the planning system.
- A majority of the UK public think that it is important for community benefits to be offered to the local community when a new onshore wind turbine is proposed nearby. Older respondents were more enthusiastic about the importance of community benefits; while a relatively small majority of 18-to-24-year-olds found community benefits to be important, over 65s were overwhelmingly of that opinion. It was also a topic of broad agreement among different 2019 voters; a large majority of the 2019 voters of all parties found community benefits important.
- A majority of the UK public think that it is important for community benefits to be offered to the local community when a new solar power farm is proposed nearby. Younger people again generally found community benefits to be less important. While a very large majority of over 65s found them to be important, only a plurality of 18-to-24-year-olds agreed. Again, also, the 2019 voters of different parties overwhelmingly agreed on their importance.
- The overwhelming preference among the UK public for community benefits is for money off energy bills. A majority of over 65s chose this option, but the same was true of only a plurality of 18-to-24-year-olds. Interestingly, this option was roughly equally popular among all levels of household income. Roughly half of the 2019 voters of all parties also had this preference.
- A majority of the UK public have said that the support of the local community should be needed to develop a new wind turbine. 18-to-24-year-olds are the only one where the view ‘the support of the local community should be needed to develop new wind turbines’ was chosen by a plurality, instead of a majority, of respondents – this is despite young people’s relative opposition to onshore wind development. Among the 2019 voters of all parties, a majority agreed that community benefits should be needed, although 2019 Conservative voters felt more strongly about this.
- A plurality of the UK public was unlikely to participate in creating a community-led development proposal for their local area. Young people were generally less likely to want to participate in the plans, but, most notably, 2019 Liberal Democrat voters were far more likely to participate in them than any single other socio-demographic grouping.
- A plurality of the UK public would be likely to join a community energy group. Younger people, those historically engaged with the planning system and those from ethnic minority backgrounds were most likely to join a community energy group. However, 2019 Conservative voters were generally less enthusiastic about community energy groups.
- A majority of the UK public support mandating that a greater proportion of new and existing buildings have solar panels fitted to them. Young people were generally less supportive of the policy. A plurality of 18-to-24-year-olds were supportive of mandating that a greater proportion of buildings have solar panels fitted to them, as compared to a large majority of over 65s. The policy was equally overwhelmingly popular among the 2019 voters of all parties.
Our polling shows that socio-demographic and voting characteristics are associated with differences in views on greater and greener housing and infrastructure development. Some characteristics emerge particularly frequently as markers of differing public attitudes.
First, age. Being younger is associated with: greater levels of concern regarding the climate resilience of one’s home; greater awareness of flood resilience measures in one’s local area; greater desire for more environmentally-friendly housing in one’s local area; greater desire for developments to have a small carbon footprint; and a greater desire to participate in a community energy group. However, it is also associated with: lower levels of concern regarding extreme weather events; lower approval of their neighbours installing a heat pump or solar panels in their home; lower approval of new onshore wind and solar energy developments; lower desire for an easier planning permission process for the development of new onshore wind and solar energy infrastructure; lower desire for the development of new settlements in undeveloped areas nearby; lower desire to participate in creating community-led local development plans; lower desire for money off their bills when community benefits are being offered to one’s community; lower importance attached to the need to offer community benefits when a new onshore wind or solar power development is being developed nearby; and, finally, a lower level of concern for local community approval when a new onshore wind farm is being developed. Conversely, being older is associated with the inverse of all those attitudes, with the exception of lower approval of their neighbours installing a heat pump or solar panels in their home, for which approval is highest amongst the middle aged. Given the high number of attitudes that differ by age, age is the most prominent marker of attitudes on greater and greener housing and infrastructure development.
Second, prior level of engagement with the planning system. Having previously engaged with the planning system is associated with: greater levels of concern regarding the climate resilience of one’s home; greater desire for more environmentally-friendly housing in one’s local area; stronger approval for local development when it is particularly environmentally friendly or climate resilient; greater levels of concern regarding building homes in a way such that it reduces carbon emissions; greater levels of support for the subsidising of local planning authorities in exchange for proactive planning for new renewable energy infrastructure; and a greater importance attached to the need to offer community benefits when a new onshore wind or solar power development is being developed nearby. However, it is also associated with: a lower desire for money off their bills when community benefits are being offered to their community; lower approval of new onshore wind and solar energy developments; and a lower desire for an easier planning permission process for the development of new onshore wind and solar energy infrastructure. Conversely, having not previously engaged with the planning system is associated with the inverse of all those attitudes.
Third, 2019 General Election vote. Having voted Conservative in the 2019 General Election is associated with a higher level of concern for local community approval when a new onshore wind farm is being developed. However, it is also associated with: lower levels of concern regarding the climate resilience of one’s home; lower desire for more environmentally-friendly housing in one’s local area; lower approval for local development when it is particularly environmentally friendly or climate resilient; lower approval of new onshore wind and solar energy developments; lower desire for an easier planning permission process for the development of new onshore wind and solar energy infrastructure; lower approval of one’s neighbours installing a heat pump in their home; and lower approval for the densification of one’s local street. Conversely, having voted for either Labour or the Liberal Democrats in 2019 is associated with the inverse of all those attitudes. Moreover, having voted for the Liberal Democrats in the 2019 General Election is associated particularly high levels of approval for an easier planning permission process for the development of new onshore wind infrastructure and a higher desire to participate in creating community-led local development plans.
Fourth, both level of education and household income. Residing in a household with a higher income and being educated to a higher level are both associated with: stronger approval for local development when it is particularly environmentally friendly or climate resilient; higher approval of new onshore wind and solar energy developments; higher desire for an easier planning permission process for the development of new onshore wind and solar energy infrastructure; and higher approval of one’s neighbours installing a heat pump in their home. Conversely, being of a lower educational level or residing in a household with a lower income are both associated with the inverse of all those attitudes.
A couple other characteristics have also emerged as less prominent markers of differing public attitudes on greater and greener development.
Identifying as either Black or Asian is associated with higher desire for the development of new settlements in undeveloped areas nearby and a higher greater desire to participate in a community energy group. Conversely, identifying as white is associated with the inverse of those attitudes.
Residing in an urban area is associated with a higher desire for more environmentally-friendly housing in one’s local area and greater levels of concern regarding the climate resilience of one’s home. Conversely, residing in a rural area is associated with the inverse of those attitudes.
Many of these characteristics will be correlated, so we cannot attribute a causal relationship between being a member of a specific demographic group or having a particular voting history and holding a certain attitude.
New policy aims
Based on our findings, Bright Blue proposes four policy aims that the UK Government should adopt.
Aim one: Build more.
The UK public consistently agrees with greater levels of greener development – both when it comes to housing and infrastructure – including in their own local communities and on previously undeveloped land.
Currently, less than 9% of English land is developed. The public preference is for this to be much greater. Not only this, a majority of the public also want to see more green housing and climate resilient development built near them. They also want to see more onshore wind and solar power, and they are generally supportive of building new settlements – something that has not happened in the UK since the 1970s.
New development, in all of its ‘green’ forms, is uncontroversially popular, including in people’s local areas. There is no excuse to shirk from it, except for the voices of small, but perhaps loud, minorities.
In order to achieve this, as we suggested in our recent report, Greater and greener homes: more homes, ready for net zero, the Government could create and fund a Neighbourhood Development Order (NDO) Pathfinder Programme to bring forward development in urban neighbourhoods. NDOs give parishes and neighbourhood groups a chance to bring forward the development they want to see in their areas for approval, rather than waiting for developers to come forward with their own proposals. NDOs are able to set clear rules on the type, design and density of homes, and are approved by residents in a referendum.
However, the current funding to deliver NDOs is limited, so achieving good design at a meaningful scale, such as a whole neighbourhood or area in a town, is challenging. In addition, the process for permitting infill and brownfield redevelopment through an NDO remains ambiguous. Perhaps above all, they are simply little known.
To make NDOs an established solution to community-led intensification, the Government needs to kickstart a programme of NDO creation in towns and suburbs which already have a local design code in place. These codes specify the local design preferences and other requirements which residents want new homes to meet. This will allow the neighbourhood planning group to move swiftly to public consultation.
Aim two: Facilitate the transition of buildings towards net zero.
Building greener will brings the UK public onboard when consenting to new development.
Very few people have a problem with heat pumps or solar panels being installed by their neighbours. Conversely, a majority of the UK public are more likely to support a development if it is ‘greener’ – such as if it has exceptionally low carbon emissions, high energy and water efficiency or is particularly climate resilient – and especially so among those who engage with the planning system.
One way to help achieve this would be to include a hierarchy of options to set higher environmental standards for more ambitious local authorities in the National Development Management Policies (NDMP), as we explore in our recent report, Greater and greener homes: more homes, ready for net zero. Local authorities could then continue to set more ambitious planning requirements than the required national minimum on issues such as reducing carbon emissions and providing green infrastructure in developments. Having a centrally-determined hierarchy would prevent a plethora of different requirements from springing up across the country while respecting the wishes of communities to insist on more sustainable development in their area.
Aim three: Consider the interests of the community when bringing forward development.
The interests of the community – whether it be regarding the provision of community benefits or the need for the support of the local community when a new development is built nearby – have consistently been judged as important by the UK public.
One way they can be reinforced is by mandating a minimum level of community benefits when bringing forward new energy infrastructure development. As we write in our recent report, Resilient neighbourhoods, powered by low-carbon energy, the provision of community benefits should be tied to the creation of Contract for Difference agreements (CfDs) for major new renewable energy projects. Instituting a minimum level of community benefits through CfD rounds would avoid downward competition between developers on the level of community benefits while ensuring community interests are recognised. Such a measure should prevent communities from losing out from any wider downward pressure on prices.
Aim four: Facilitate the development of more renewable energy infrastructure, both on sea and land.
Solar, offshore and onshore wind all are highly popular among the UK public. A large majority support the development of both solar and onshore power, while offshore power remains the most popular choice for development on English offshore waters – though floating solar farms are popular also.
As opposed to the sometimes prevailing narrative about older people being opposed to new development, our findings suggest that it is older people who are the greatest champions of renewable energy infrastructure. Although the development of renewable energy is favoured across all age groups, older people are the most likely to want more solar and onshore wind developments.
The Government could facilitate their development by rewarding local planning authorities in exchange for proactive planning for more renewable energy infrastructure developments – a policy that the UK public supports. As we write in our recent report, Resilient neighbourhoods, powered by low-carbon energy, this should not be excessively costly – according to the Royal Town Planning Institute, in 2020-21, net expenditure by local planning authorities was just £480 million, which is only around 0.4% of the total expenditure by English local authorities. Those resources could be an extension of the existing Planning Skills Delivery Fund – a £24 million grant from the DLUHC to help local authorities with the implementation of the reforms in the 2023 Levelling Up and Regeneration Act.
Such resourcing could prioritise those local planning authorities with significant potential for renewable energy generation and which have considerable need and desire to coordinate the exploitation of this capacity.
Another option, also explored in Resilient neighbourhoods, powered by low-carbon energy, is to draw up marine spatial plans for English offshore waters that prioritise renewable energy. The use of proactive spatial planning to help steer offshore wind and other marine energy development away from the most environmentally-sensitive areas would also support the swift handling of development application consents, insofar as the riskiest areas will have been avoided. Such plans might also identify areas and options for investment in strategic compensation schemes, designed to help offset the biodiversity impacts of offshore energy development.
Such a step should not be problematic. It has been widely called for by government-commissioned inquiries. Scotland already has spatial plans that allocate land for marine renewables. The task could be given to the Marine Management Organisation NDPB, since its powers already enable it to engage in marine planning.
Author
Bartek Staniszewski is a Senior Researcher at Bright Blue.
Acknowledgements
This report has been made possible by the generous support of the European Climate Foundation. The ideas expressed in this publication do not necessarily reflect the views of our sponsors. I would like to thank Ryan Shorthouse for his editing and feedback, as well as Emily Taylor for her communications work on it. I would also like to thank Charlie Buckley and the Survation team for their hard work and attention to detail advising on and carrying out the survey.
The full data tables for the polling can be found here.
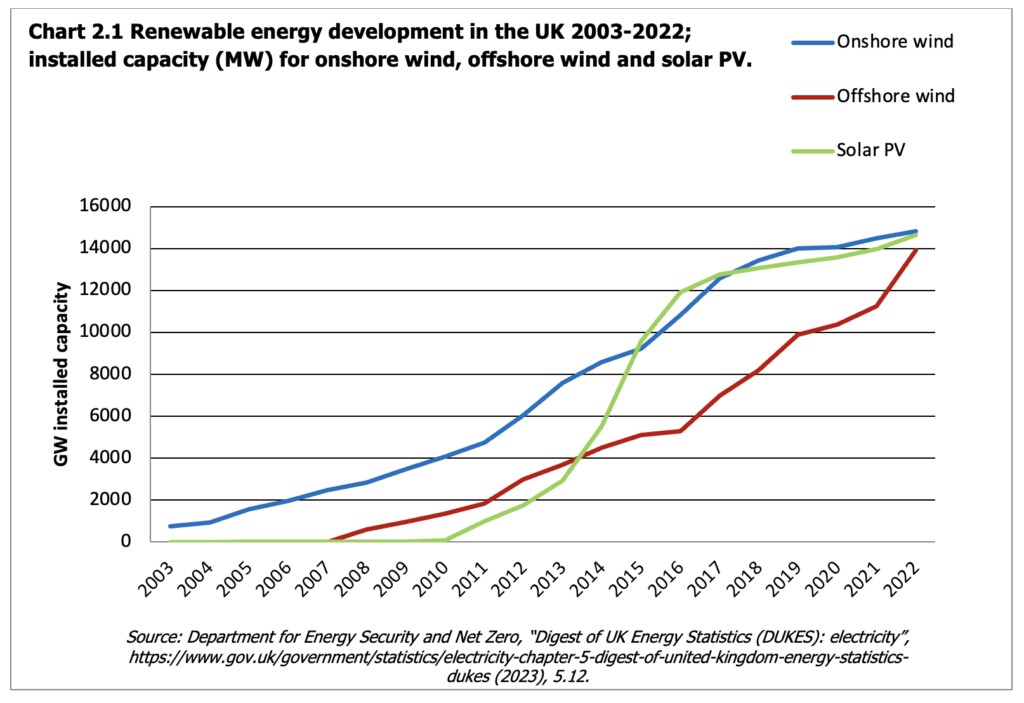
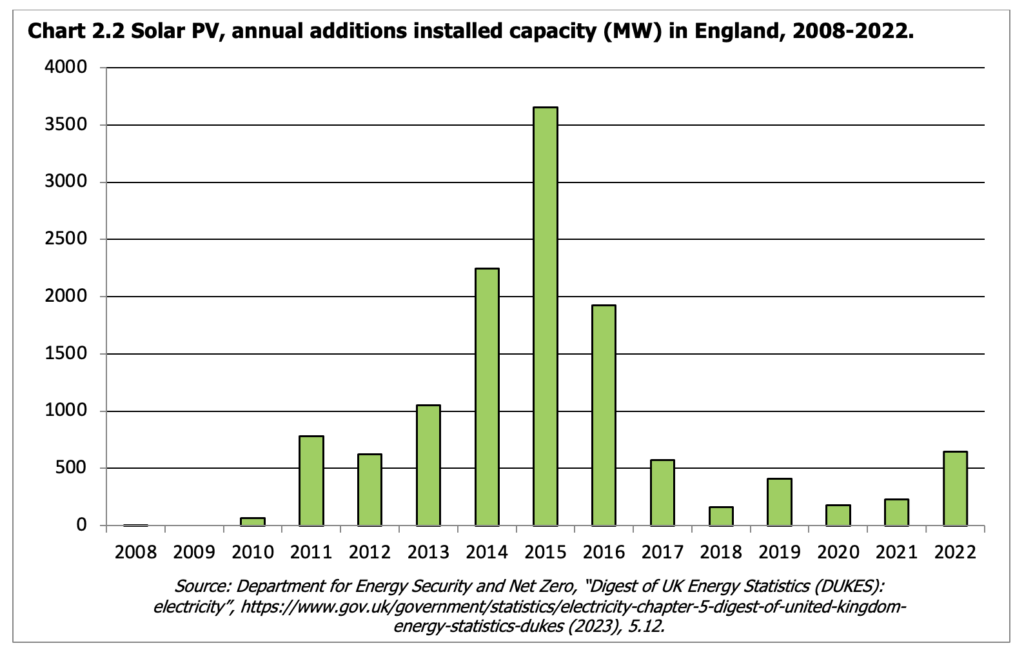
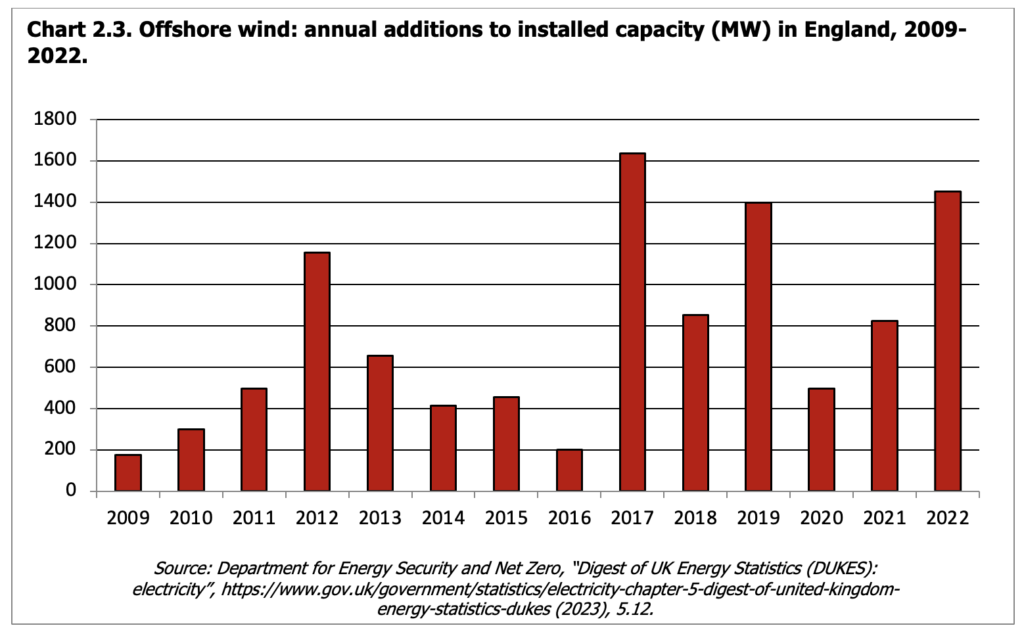 This growth has been, again, propelled by economics. Offshore wind has been the major beneficiary of the Government’s CfD market support programme, which has helped to stabilise revenue and incentivise major commercial investment. Support for research and development and the adoption of larger, more efficient turbines, assembled in bigger projects, has helped push down the price of power from offshore wind to as low as £37.35/MWh (CfD Round 4).
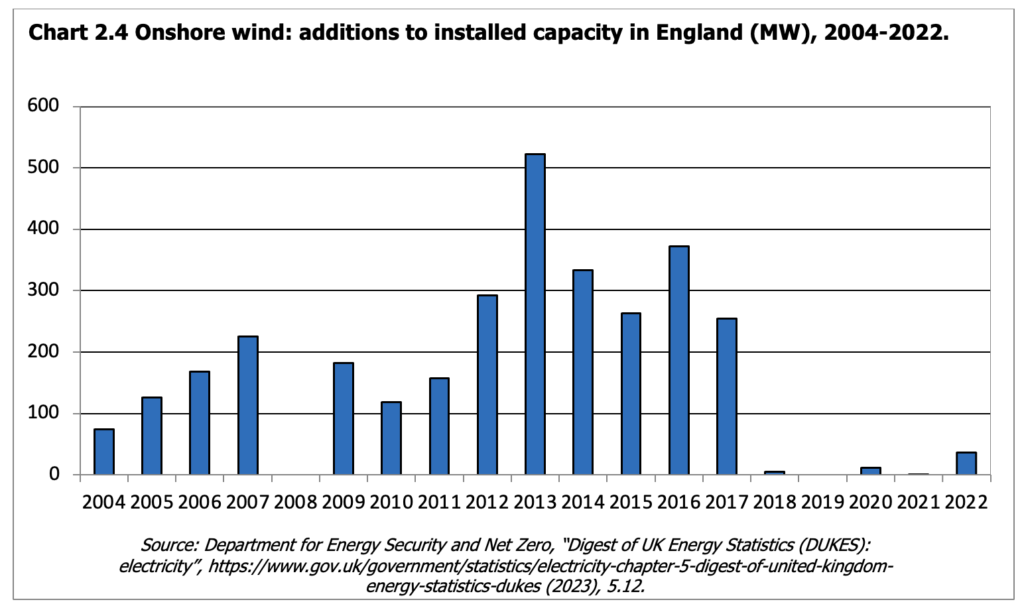

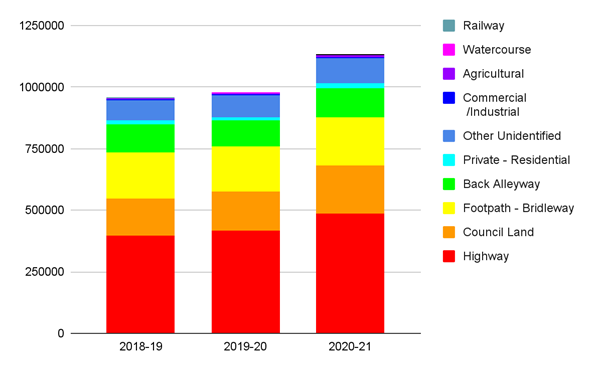 Source: Department for Environment, Food and Rural Affairs, “ENV24 – Fly tipping incidents and actions taken in England”, 2021.