Chapter 2: Housing and infrastructure
Having established that people are concerned about the effects of climate change on their homes and neighbourhoods, we wanted to test public attitudes towards new housing and infrastructure development – in particular, housing and infrastructure that is consistent with reducing carbon emissions and protecting the natural environment, both in terms of climate and biodiversity.
First, we asked what proportion of UK land should remain undeveloped in the long term. We did this to ascertain the overall levels of development that the UK public would find desirable and how those compare to the current levels of development in the UK.
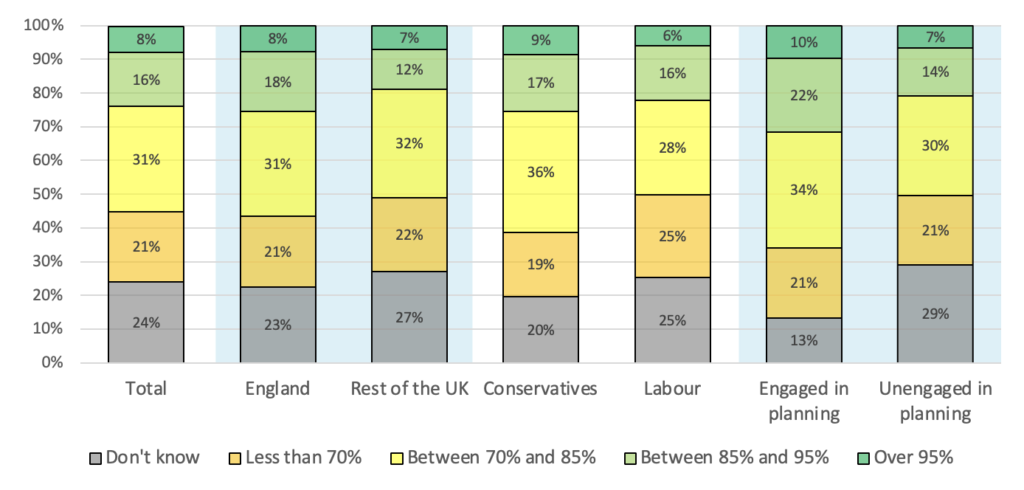
In general, the UK public seems to believe that the amount of land that is developed on in the UK should be far greater than it currently is. As illustrated in Chart 5 below, a plurality of the UK public (31%) thinks that between 70 and 85% of UK land should remain undeveloped in the long term. By comparison, currently in England – the country in the UK with the smallest proportion of undeveloped land – 91.1% of land is undeveloped. The implication of this is that a majority of the UK public (52%) think that the proportion of land that is undeveloped in the UK should be less than what it is. Only a small minority of 8% unequivocally think that the proportion of land in the UK that is undeveloped should be more than it is.
Chart 5. Views of the public on what proportion of UK land should remain undeveloped in the long term.
 Base: 2,243 UK adults.
There was very little variation among different socio-demographic groups regarding their responses to this question. A plurality of respondents in all tested groups said that between 70 and 85% of UK land should remain undeveloped in the long term. The greatest socio-demographic variation was between respondents from England and those from the rest of the UK, with respondents from England favouring slightly lower development levels; nonetheless, a plurality of respondents from both England (31%) and the rest of the UK (32%) favoured development levels of between 15 and 30%.
The chief difference between respondents engaged and unengaged with the planning system was the likelihood to answer ‘Don’t know,’ with that option being chosen by 29% of respondents unengaged with the planning system, but only 13% of those engaged with the planning system. A plurality of both groups favoured for between 70 and 85% of UK land to remain undeveloped, with 34% of those engaged with planning favouring this option, as compared to 30% of those unengaged with planning.
Variation was greater, but still small, between the voters of different parties. A plurality of the voters of all three major parties favoured for between 70% and 85% of UK land to remain undeveloped in the long term, with 36% of 2019 Conservative voters, 28% of 2019 Labour voters and 27% of 2019 Liberal Democrat voters choosing this option. Notably, Labour voters were around a third less likely to support over 95% of UK land remaining undeveloped in the long term as compared to 2019 Conservative voters.
Given the high levels of support for greater levels of development in the UK in general, we then went on to ask the UK public about the specific kinds of development that they would support.
Housing
First, we asked the UK public how much green housing – such as housing with exceptionally low carbon emissions and high energy and water efficiency – they want developed in their local areas. We did this to understand the desire for greater and greener housing development levels in the UK, as opposed to just development generally.
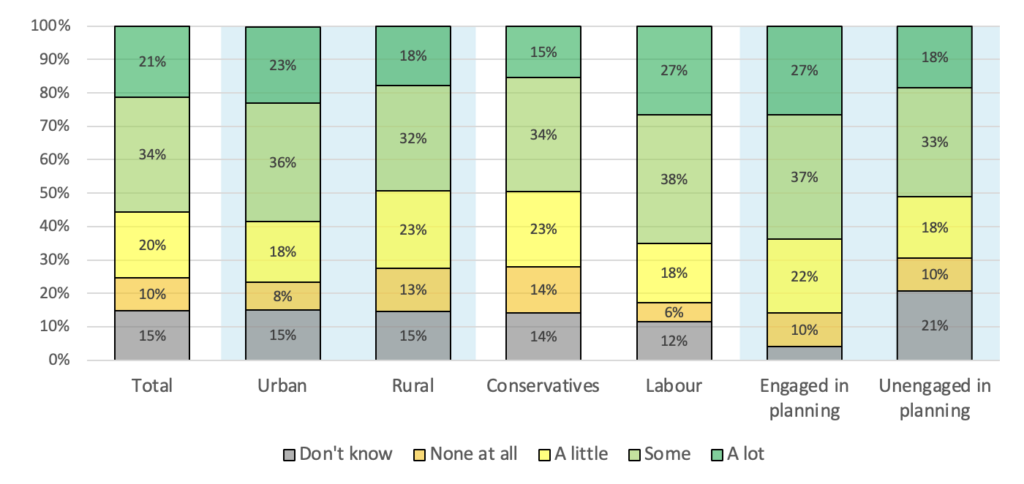
As can be seen in Chart 6 below, a strong majority of the UK public (75%) support a little (20%), some (34%) or a lot (21%) more green housing development in their local area. A small minority of 10% want none at all.
Chart 6. Views of the public on the development of more green housing in one’s local area.
 Base: 2,243 UK adults.
Responses varied slightly by age and, most prominently, local area. While all age groups were similarly likely to say that they want new green housing in their local area, older respondents were more likely to say that they want ‘none at all,’ with 13% of over 65s choosing that option as compared to only 8% of 18-to-24-year-olds.
Understandably, those living in urban areas were also more likely to support more new green housing in their local area than those living in rural areas. Again a majority of both groups wanted more of such housing, with 77% of respondents from urban areas and 73% of respondents in rural areas choosing that option, but respondents from urban areas were more likely to favour a lot of it; 23% of respondents from urban areas wanted a lot of new green housing in their local areas compared to 18% of respondents from rural areas, and only 9% of respondents from urban areas wanted no new green housing in their local area at all, as contrasted with 13% of respondents from rural areas.
Those engaged with the planning system were generally slightly more supportive of new green housing development in their local area. As with all other demographic variations, a majority of both those respondents engaged and unengaged with planning favoured new green housing development in their local area – 86% of those engaged and 69% of those unengaged – but, while only 18% of those unengaged with the planning system wanted a lot of it, the same was true for 27% of those engaged with the planning system, suggesting that green housing may command good support in the planning consenting process.
Finally, when it came to political variation, 2019 Conservative voters were far more likely to want less new green housing in their local area than the voters of other major parties. A majority of respondents among all political groupings wanted new green housing in their local area – 72% of Conservatives, 83% of Labour voters and 82% of Liberal Democrats – but, while 27% of Labour voters and 31% of Liberal Democrat voters wanted a lot of such housing, the same was true for only 15% of Conservative voters. Conversely, 14% of Conservative voters wanted no such housing at all; the same was true of only 6% of both Labour and Liberal Democrat supporters.
We then asked the UK public how much more likely they are to support a new housing development in their local area if the homes that form a part of it meet high environmental standards, such as if it has exceptionally low carbon emissions or high energy and water efficiency. We did this to understand whether high levels of support for new housing are to do with the housing being ‘green,’ or whether they are to do with support for new housing generally.
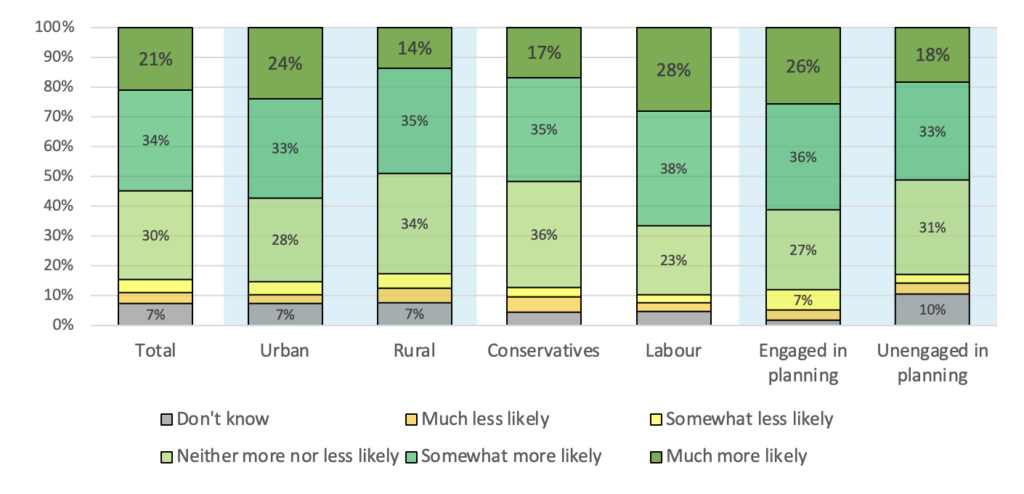
It is clear from the results that a housing development being more ‘green’ has a strong positive effect on the public’s level of support for it. A majority of the UK public (55%) was more likely – either ‘somewhat’ or ‘much more’ – to support new housing development in their local area if it meets a high environmental standard. Only a small minority of the UK public (8%) was less likely – either ‘somewhat’ or ‘much less’ – to support a new housing development on account of it.
Chart 7. Views of the public on whether one is more likely to support new housing development in one’s local area if it meets a high environmental standard.
 Base: 2,243 UK adults.
Again, there were some differences in responses between respondents from rural and urban areas. While a majority of respondents from urban areas (57%) said that they are net more likely to support a new housing development on account of it meeting a high environmental standard, only 49% of respondents from rural areas said the same. Moreover, while 24% of respondents from rural areas were ‘much more likely’ to support it, the same was true of only 14% of respondents from rural areas.
Also significant was variation between respondents with different income and education levels. A plurality of respondents educated to basic GCSE level or below (47%) said that they net more likely to support a new housing development on account of it meeting a high environmental standard, while a majority of university graduates (67%) said the same. University graduates were also over twice as likely to say they are much more likely to support such a development as compared with respondents educated to basic GCSE level or below; 31% of university graduates picked that answer, but only 15% of respondents educated to basic GCSE level or below did the same.
An analogous pattern followed for respondents on different incomes, with a majority of those in households earning over £40,000 a year (61%) being net more likely to support a new housing development on account of it meeting a high environmental standard, as compared to a plurality of those in households earning under £20,000 a year (43%).
Worth noting is that those engaged with the planning system were significantly more likely to find high environmental standards to be a cause for their support for a new housing development; again, a majority of those engaged with planning system (62%) was net more likely to support a new housing development on account of it meeting a high environmental standard, as was a majority of those unengaged in planning (51%), but, while only 18% of those unengaged in the planning system were much more likely to support a more environmentally-friendly development, the same was true for 26% of respondents engaged with planning.
Finally, as with the previous question, 2019 Conservative voters were again less enthusiastic about ‘green’ housing. A small majority of them (52%) was net more likely to support a new housing development on account of it meeting a high environmental standard, but a large majority of both Labour voters (66%) and Liberal Democrat voters (67%) was net more likely to support it. Of the respondents who were much more likely to support a new housing development on account of it meeting a high environmental standard, they were also less likely to vote Conservative than otherwise; only 17% of Conservative voters chose that option, as contrasted with 28% of Labour voters and 27% of Liberal Democrat voters.
Next, we asked a similar question, but regarding climate resilience; we asked the UK public how much more likely they are to support a local development if it is especially climate resilient – for example, if it was ensured that this development is resistant to flooding and that it protects those inside it from overheating. We did this to understand whether climate resilience is a priority for the UK public when it comes to new housing development.
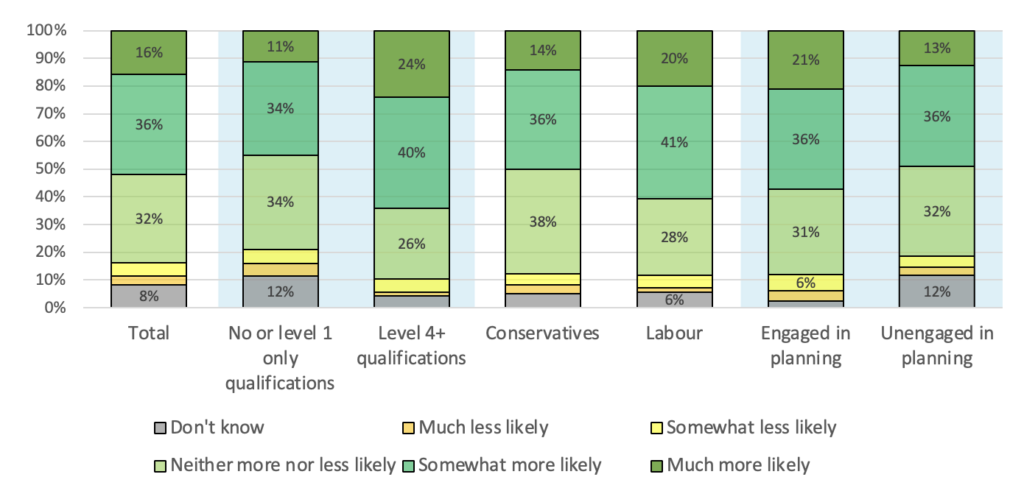
Once again, a similar story features – development being more climate resilient has a definite positive effect on the UK public’s level of support for it. A majority of the UK public (52%) was net more likely – either ‘somewhat’ or ‘much more’ – to support new development in their local area if it is especially climate resilient. Only a small minority of the UK public (8%) was less likely to support a new development on account of it. This is shown in Chart 8 below.
Chart 8. Views of the public on whether one is more likely to support new development in one’s local area if it is particularly climate resilient.
 Base: 2,243 UK adults.
As before, there were some differences between respondents with different income and education levels. A plurality of respondents educated to basic GCSE level or below (45%) said that they are net more less likely to support a new housing development on account of it particularly climate resilient, while a majority of university graduates (64%) said the same. University graduates were also over twice as likely to say they are much more likely to support such a development as compared with respondents educated to basic GCSE level or below; 24% of university graduates picked that answer, but only 11% of respondents educated to basic GCSE level or below did the same.
The pattern repeated also for respondents on different incomes, with a majority of those in households earning over £40,000 a year (60%) being net more likely to support new development on account of it being especially climate resilient; for those in households earning under £20,000 a year, this was only a plurality (49%). Twenty percent of respondents in households earning over £40,000 a year were also much more likely to support such a development; a view held by only 13% of respondents in households earning under £20,000 a year.
Those engaged with the planning system were again somewhat more likely to find climate resilience to be a cause for their support for a new development. A majority of those engaged with planning system (57%) was net more likely to support a new development on account of it being especially climate resilient, as was a plurality of those unengaged in planning (49%), but while only 13% of those unengaged in the planning system were much more likely to support a more climate resilient development, the same was true for 21% of respondents engaged with planning.
Finally, non-Conservative voters were more likely to favour climate resilience in development. A half of 2019 Conservative voters (50%) was net more likely to support a new development on account of it being especially climate resilient, but the same was true of 61% of Labour and 62% of Liberal Democrat voters.
Having established high levels of support for greener housing development, we asked the public to specify what pro-environmental adjustments they would most like to see in new developments in their local area. Respondents were able to pick any top two of the possible answers provided. We did this to narrow down whether any particular pro-environmental adjustments were more popular than others where it comes to planning consent.
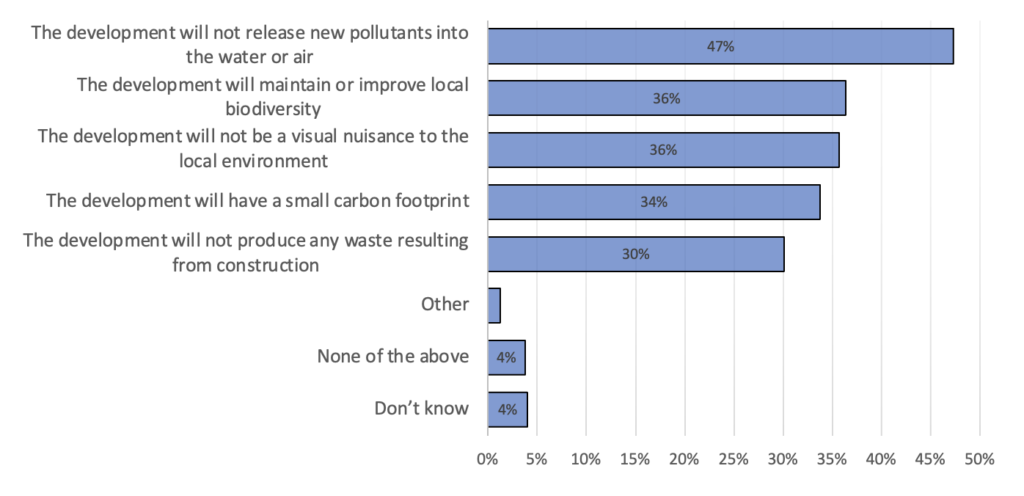
As can be seen in Chart 9 below, a plurality of the UK public (47%) thought that the development not releasing new pollutants into the water or air is one of the top two pro-environmental adjustments that would make them more supportive of new development in their local area. That said, the least popular pro-environmental adjustment – that the development will not produce any waste resulting from construction – was still a top-two adjustment for a large minority (30%) of the UK public.
Chart 9. Views of the public on the most popular pro-environmental adjustments for local development.
 Base: 2,243 UK adults.
There was no strong variation between the responses of the UK public with different socio-economic characteristics. The most significant variation came with age, with younger respondents generally more concerned with development having a small carbon footprint and slightly more concerned with local biodiversity; while a plurality of both 18-to-24-year-olds (49%) and over 65s (49%) agreed that not releasing new pollutants into the water or air is a desirable pro-environmental adjustment, also 42% of 18-to-24-year-olds held that view regarding the development having a small carbon footprint – as compared with 25% of over 65s – and regarding the development maintaining or improving local biodiversity – as compared with 32% of over 65s.
There was no significant variation at all between the responses of those engaged and unengaged in the planning system. A plurality of both groups said that not releasing new pollutants into the water or air an important adjustment, with 47% of those engaged in planning and 48% of those unengaged in planning holding that view.
The voters of different parties were also broadly in agreement on their responses to this question. A plurality of 2019 Conservative voters (44%) found not releasing new pollutants into the water or air an important adjustment, as did a plurality of 2019 Labour (49%) and a majority of 2019 Liberal Democrat (58%) voters. Their greatest disagreement was regarding the importance of the development having a small carbon footprint, with only 28% of 2019 Conservative voters picking that option, as contrasted with 35% of 2019 Labour and 41% of 2019 Liberal Democrat voters.
Infrastructure
Having explored the UK public’s views on the development of greater and greener housing, we asked about whether and how they would support the development of more low-carbon energy infrastructure.
First, we asked the public whether they support new onshore wind power development, and, if so, whether they do it regardless of where it takes place or only in certain areas. This question sought to ascertain the UK public’s level of support for onshore wind as compared to other types of development.
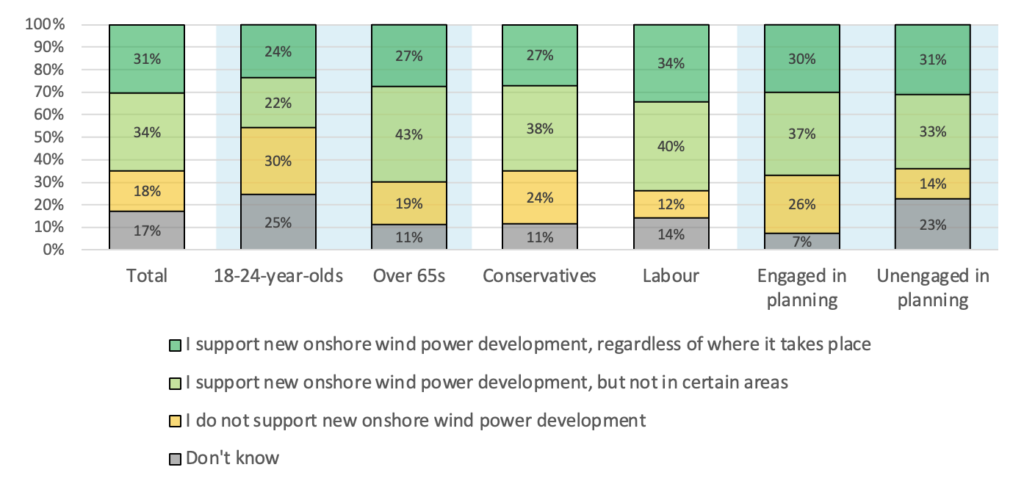
As can be seen in Chart 10 below, a majority of the UK public (65%) supported new onshore wind power developments. This is as compared to only 18% who do not. Of those who supported new onshore wind power development, they were almost evenly split on whether they support it unconditionally of its location (31% of the total UK public) or only in certain areas (34% of the total UK public).
Chart 10. Views of the public on the development of new onshore wind farms in the UK.
 Base: 2,243 UK adults.
There was some variation between responses from respondents of different ages, with younger respondents generally less supportive of new onshore wind power development. While a large majority of over 65s (70%) supported new onshore wind power developments, the same is true of only a plurality of 18-to-24-year-olds (46%). However, of those 18-to-24-year-olds supportive of new onshore wind power developments, 52% (24% of all 18-to-24-year-olds) supported them regardless of their location; the same can be said for only 39% (27% of all over 65s) of over 65s supportive of new onshore wind power developments.
Responses also varied slightly between respondents with different educational levels, with university graduates generally more supportive of onshore wind; a large majority of university graduates (74%) supported new onshore wind power developments, as compared to a smaller majority of respondents educated to basic GCSE level or below (56%).
Those who have historically engaged with the planning system were also more likely to be unsupportive of onshore wind – possibly caused by the fact that their opposition to an onshore wind development proposal is the reason why they are included in the category of ‘engaged with the planning system.’ While a majority of both those engaged (67%) and unengaged (64%) with the planning system supported the development of new onshore wind farms, those engaged with the planning system were almost twice as likely to be unsupportive of it, with 26% of them stating that as their response – this is as contrasted with only 14% of respondents unengaged with the planning system.
2019 Conservative voters were generally less supportive of onshore wind as compared to the voters of other parties: although new onshore wind power developments were supported by a majority of 2019 Conservative respondents (65%), the level of support was even higher among 2019 Labour (74%) and 2019 Liberal Democrat (79%) voters. Conservative voters were also twice as likely to oppose new onshore wind power developments, with 24% of them doing so, as compared to only 12% of 2019 Labour and 11% of 2019 Liberal Democrat voters.
As a follow-up to this question, we asked those who only support the development of onshore wind conditionally on its location which areas should not be used for onshore wind power development. We did this to find out what areas would be most suitable for such developments.
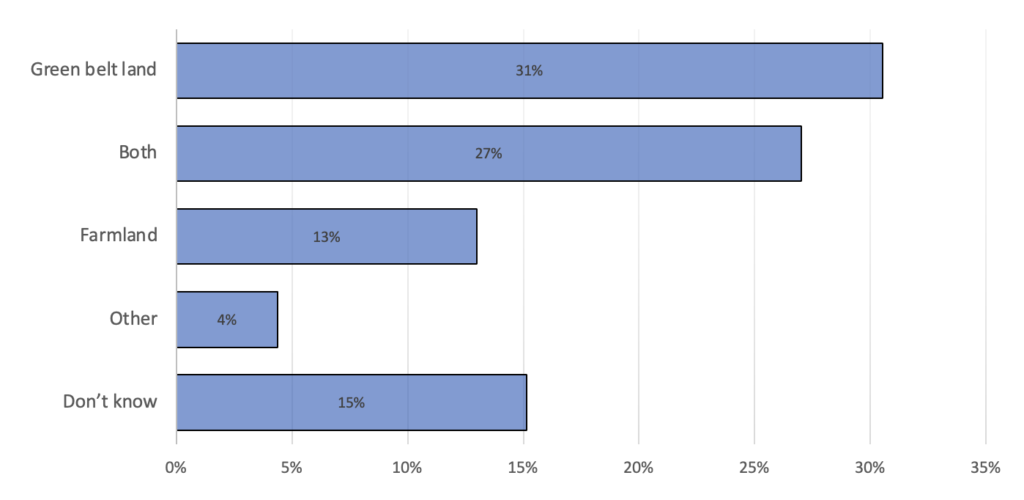
Of those who only support the development conditionally on its location, responses were divided as to what locations should be excluded. As can be seen in Chart 11 below, a majority of the UK public (58%) who only support onshore wind development in certain areas think that green belt land should be excluded from onshore wind development.
Chart 11. Views of the public on the areas that should not be used for onshore wind power development.
 Base: 766 UK adults who support onshore wind power development, but not in certain areas.
Due to the small sample size here, examining disparities in the responses to this question across other demographic divisions is impossible to conduct accurately.
We also asked a question about the planning process for onshore wind farms specifically; namely, whether it should be easier or harder to acquire planning permission to build onshore wind farms. The hope here was to draw out those who support onshore wind power provision more broadly but think that it is important to keep existing planning restrictions on its development.
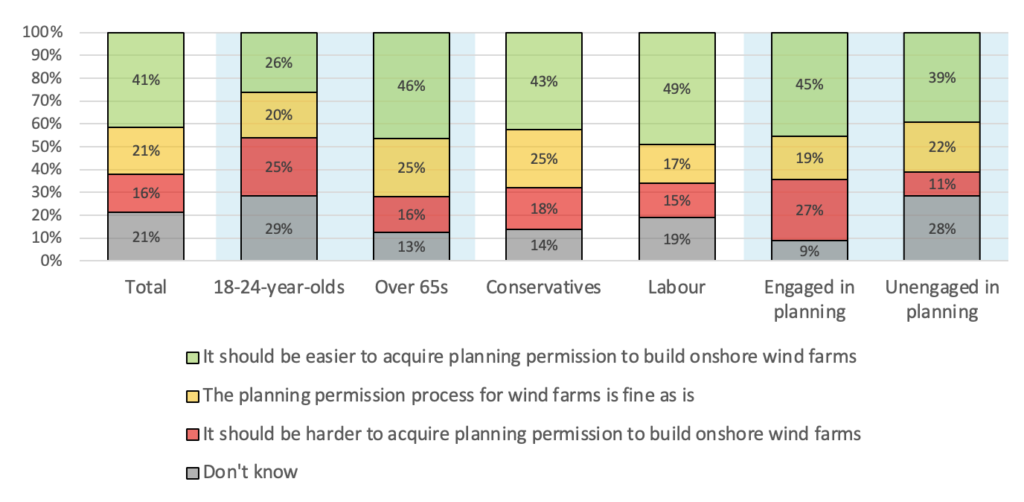
A plurality of respondents (41%) think that it should be easier to acquire planning permission to build onshore wind farms, as can be seen in Chart 12 below. In contrast, the response that ‘it should be harder to acquire planning permission to build onshore wind farms’ was the least common choice among respondents, with only 16% being of that opinion. Indeed, the view that ‘it should be easier to acquire planning permission to build onshore wind farms’ was the most popular choice among all groups for which we were able to test, except for some groups choosing ‘don’t know.’
Chart 12. Views of the public on the planning permission process for onshore wind farms.
 Base: 2,243 UK adults.
The most variation between responses to this question happened between different age groups, with younger people generally being less in favour of an easier planning process for onshore wind farms. A plurality of 18-to-24-year-olds (29%) did not know what their view on the planning permission process for onshore wind farms is. This is as contrasted with over 65s, of whom almost half (46%) thought that the planning permission process for onshore wind farms should be easier; indeed, only a small minority of over 65s (16%) thought it should be harder.
Those who have engaged with the planning system were generally more likely to think that the current planning permission process for onshore wind farms should be more difficult. A plurality of both those engaged (45%) and unengaged (39%) in planning thought that the process should be easier, however, a large minority of those engaged with the planning system (27%) thought that it should be harder; this is as compared to a small minority of 11% for those unengaged with the planning system.
Broadly, there was agreement between 2019 voters of the different political parties on the planning permission process for onshore wind farms. A plurality of both Conservative (43%) and Labour (49%) voters thought that it should be easier. Liberal Democrats were the most supportive of an easier planning permission process, with a majority of them (56%) picking that option.
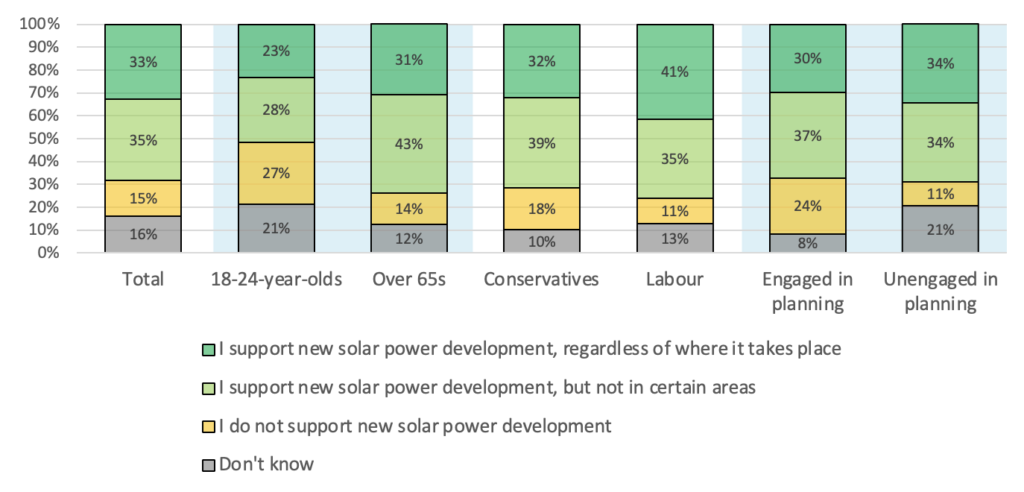
Having discovered the UK public’s views on onshore wind development, we wanted to do the same for solar development. As such, we asked analogous questions – first, we asked the public whether they support new solar power development, and, if so, whether they do it regardless of where it takes place or only in certain areas.
As can be seen in Chart 13 below, a majority of the UK public (68%) supported new solar farm developments. This is as compared to only 15% who do not. Of those who supported new onshore wind power development, they were almost evenly split on whether they support it unconditionally of its location (33%) or only in certain areas (35%).
Chart 13. Views of the public on the development of new solar farms in the UK.
 Base: 2,243 UK adults.
There was some variation between responses from respondents of different ages, with younger respondents generally less supportive of new solar power development. While a large majority of over 65s (74%) supported new onshore wind power developments, the same is true of only a smaller majority of 18-to-24-year-olds (51%).
Responses also varied again between respondents with different educational levels, with university graduates generally more supportive of solar power; a very large majority of university graduates (76%) supported new solar farm developments, as compared to a smaller majority of respondents educated to basic GCSE level or below (59%).
Respondents on higher incomes were also more likely to be supportive of new solar farm developments. A large majority of those in households earning over £40,000 a year (72%) supported new solar power development, but the same is true of only 54% of those in households earning under £20,000 a year.
Those who have historically engaged with the planning system were more likely to be unsupportive of solar power. While a majority of both those engaged (67%) and unengaged (68%) with the planning system supported the development of new solar farms, those engaged with the planning system were over twice as likely to be unsupportive of it, with 24% of them stating that as their response – this is as contrasted with only 11% of respondents unengaged with the planning system.
There was broad agreement between the 2019 voters of different parties on the question of solar power, with a large majority of the voters of all major parties supporting new solar farm developments. Seventy-one percent of 2019 Conservative voters supported new solar power development, as did 76% of 2019 Labour voters and 81% of 2019 Liberal Democrat voters.
As a follow-up to this question, we asked those who only support the development of solar farms conditionally on their location which areas should not be used for solar power development. We did this to find out what areas would be most suitable for such developments.
Responses to this question were very divided. Of those who support solar power development only in certain areas, a majority (57%) think that green belt land should be excluded from solar farm development, 48% think that farmland should be excluded and 25% think that both farmland and green belt land should be excluded.
Chart 14. Views of the public on the areas that should not be used for solar power development.
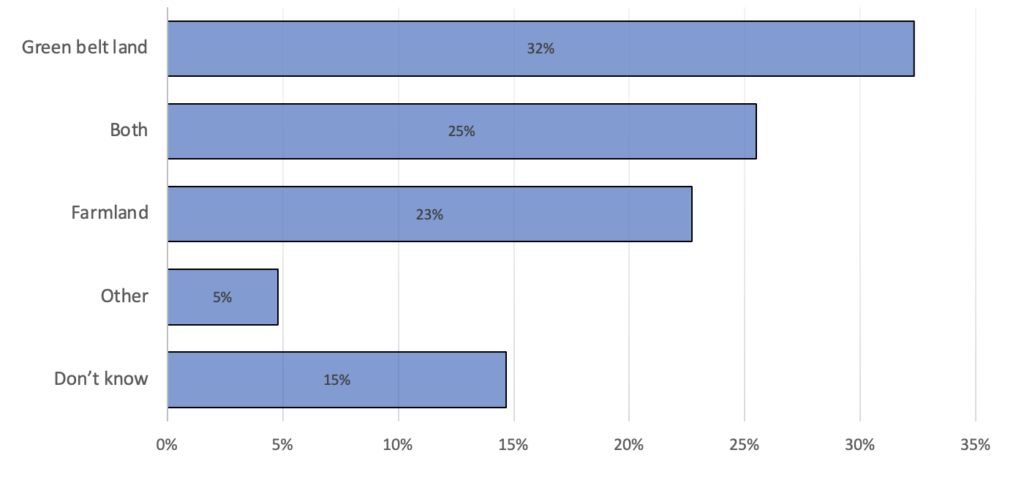 Base: 778 UK adults who support solar power development, but not in certain areas.
Due to the small sample size here, examining disparities in the responses to this question across other demographic divisions is impossible to conduct accurately.
We also asked a question about the planning process for solar farms specifically; namely, whether it should be easier or harder to acquire planning permission to build solar farms. The hope here was to draw out those who support solar power provision more broadly but think that it is important to keep existing planning restrictions on its development.
A plurality of respondents (44%) think that it should be easier to acquire planning permission to build solar farms, as can be seen in Chart 15 below. In contrast, the response that ‘it should be harder to acquire planning permission to build solar farms’ was the least common choice among respondents, with only 16% being of that opinion. Indeed, the view that ‘it should be easier to acquire planning permission to build solar farms’ was the most common choice among all socio-economic and political groups for which we were able to test, echoing the findings for UK public attitudes towards planning permission for onshore wind development.
Chart 15. Views of the public on the planning permission process for solar farms.
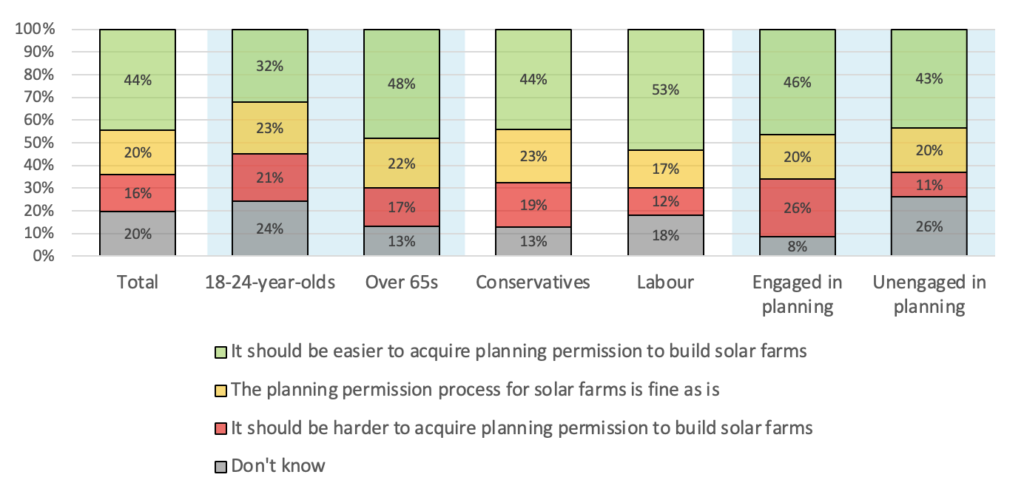 Base: 2,243 UK adults.
Again, the most variation between responses to this question happened between different age groups, with younger people generally being less in favour of an easier planning process for solar farms. While not as divided as on onshore wind, older people were again more likely to support an easier planning process for solar power, with a large plurality of over 65s (48%) saying that ‘it should be easier to acquire planning permission to build solar farms;’ this is as contrasted with a smaller plurality of 18-to-24-year-olds (32%).
Those who have engaged with the planning system were again more likely to think that the current planning permission process for solar farms should be more difficult. A plurality of both those engaged (46%) and unengaged (43%) in planning thought that the process should be easier, however, a large minority of those engaged with the planning system (26%) thought that it should be harder; this is as compared to a small minority of 11% for those unengaged with the planning system.
2019 Conservatives were slightly more likely to be supportive of a harder planning permission process for solar farms. While a plurality of 2019 Conservative voters (44%) said that the process should be easier, that view was held by a majority of both 2019 Labour (53%) and 2019 Liberal Democrat (56%) voters. Conversely, 19% of 2019 Conservatives thought that the process should be harder, as contrasted with only 12% of 2019 Labour and 13% of 2019 Liberal Democrat voters.
For our final question on developmental preferences, we wanted to understand the UK public’s preferences in regard to water use, and not just land use. Therefore, we outlined to the UK public that, sometimes, an area of English offshore waters is suitable for a range of different developments. We then asked which of the listed types of infrastructure government should prioritise when targeting English offshore waters for development.
As is visible in Chart 16 below, both solar and wind power were popular among UK respondents when competing for UK water space, and not just land. When given a choice between different development priorities for English offshore waters, a majority of the UK public (53%) believed that offshore wind farms should be a priority, and 41% believed that floating solar farms should be a priority: by far the two most popular respondents among UK respondents. By contrast, only 23% of respondents thought that oil and gas platforms should be a priority.
Chart 16. Views of the public on the development types that should be prioritised for English offshore waters.
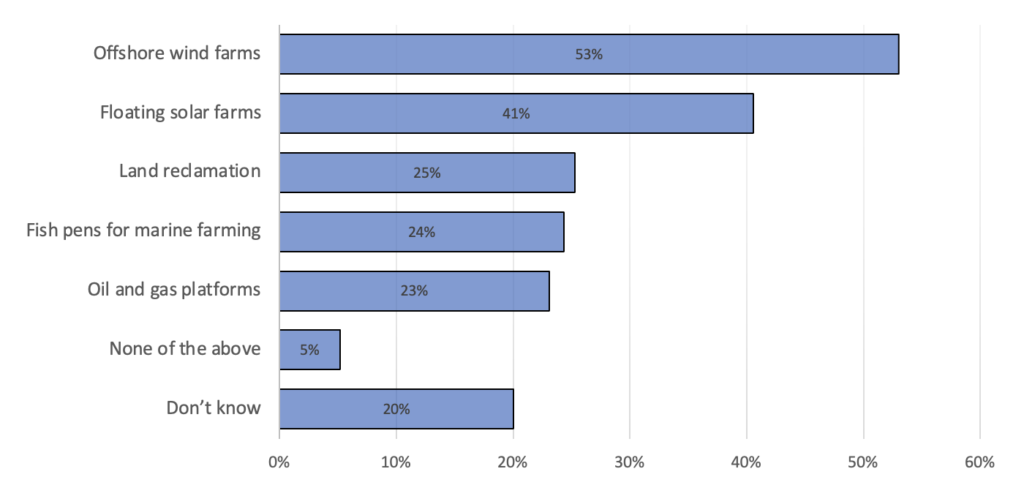 Base: 2,243 UK adults.
Again, responses to this question varied slightly between respondents of different ages. Most notably, older respondents were more enthusiastic about offshore wind, with a majority of over 65s (65%) choosing it as a development type that should be prioritised for English offshore waters. By contrast, only a plurality of 18-to-24-year-olds (34%) were of the same view.
Responses also did not vary significantly between the 2019 voters of different political parties. A majority of the voters of all major parties agreed that offshore wind farms should be a development priority for English offshore waters, with 59% of 2019 Conservative, 59% of 2019 Labour and 66% of 2019 Liberal Democrat voters acquiescing to that view. The most notable difference concerned views regarding oil and gas platforms; while 29% of 2019 Conservative voters thought they should be a priority, only 20% of 2019 Labour voters were of the same opinion.
Development concerns
Having established strong levels of support among the UK public for more housing and infrastructure development generally, we wanted to explore the reasons why one might nonetheless oppose – or at least have reservations regarding – such developments.
First, we asked the UK public about whether they have any concerns about developers in the UK building housing in a way such that it emits less carbon. Respondents could tick all options that apply. We did this to understand whether the public considers that the aims of greater and greener housing development conflict.
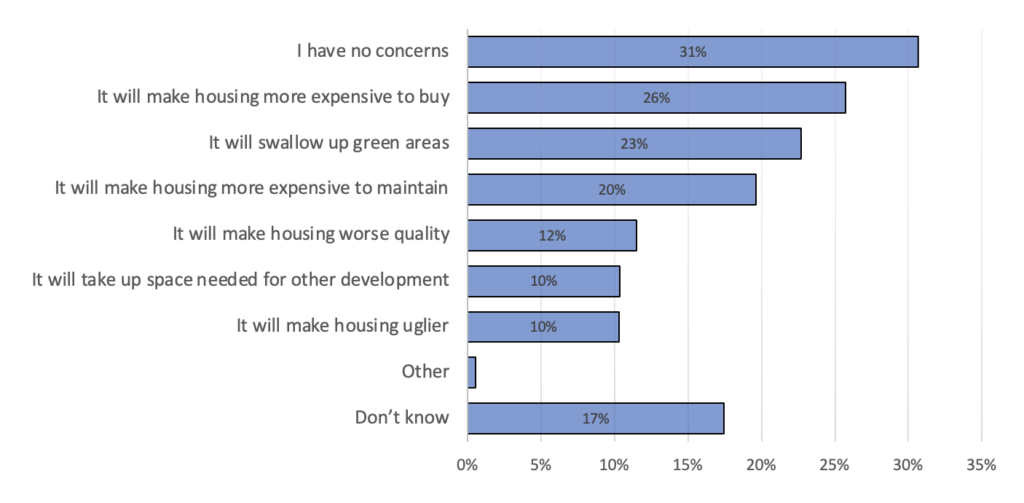
As shown in Chart 17 below, a plurality of the UK public (31%) had no concerns regarding developers building housing in a way such that it emits less carbon. Of those who did have at least one such concern, the most common concerns were that it will make housing more expensive to buy (26%) and that new such housing will swallow up green areas (23%).
Chart 17. Views of the public on developers building housing in a way such that it emits less carbon.
 Base: 2,243 UK adults.
Responses did not vary significantly between different socio-economic demographics except sex and, most prominently, age. Only 22% of 18-to-24-year-olds had no concerns regarding developers building housing in a way such that it emits less carbon; a plurality (27%), however, was concerned that it will make housing more expensive to buy. Conversely, 39% of over 65s had no concerns regarding developers building housing in a way such that it emits less carbon; the most common response of the options available among that age bracket.
Male respondents were also slightly less likely to have concerns regarding developers building housing in a way such that it emits less carbon, with 35% of them espousing that view as compared to only 26% of female respondents, although it was a plurality response for both sexes. Women (22%) were also much more likely than men (13%) to pick ‘Don’t know’ as their answer.
There were also some differences in the concerns had by people engaged and unengaged with the planning system. The most common response for both groups was to say that one has no concerns – a response given by 29% of those engaged and 32% of those unengaged – but those engaged with the planning system were significantly more likely to be concerned about environmentally-friendly housing swallowing up green areas (29 vs 19%), being uglier (17 vs 6%), taking up space needed for other development (17 vs 7%) and being worse quality (17 vs 8%).
Along party lines, there were no major discrepancies. The most common response among both 2019 Conservative (34%) and 2019 Labour (34%) voters was to say that one has no concerns. 2019 Liberal Democrat voters were slightly less likely to have no concerns (29%), a plurality of whom (29%) were concerned that building housing in a way such that it emits less carbon will make it more expensive to buy.
Second, we asked the UK public about whether they would be concerned about their neighbours making adjustments to their homes that reduce those homes’ carbon emissions. We did this to ascertain whether there would be significant opposition to relaxing the UK planning law on making such adjustments without having to seek planning permission.
The first such adjustment we asked about was heat pumps.
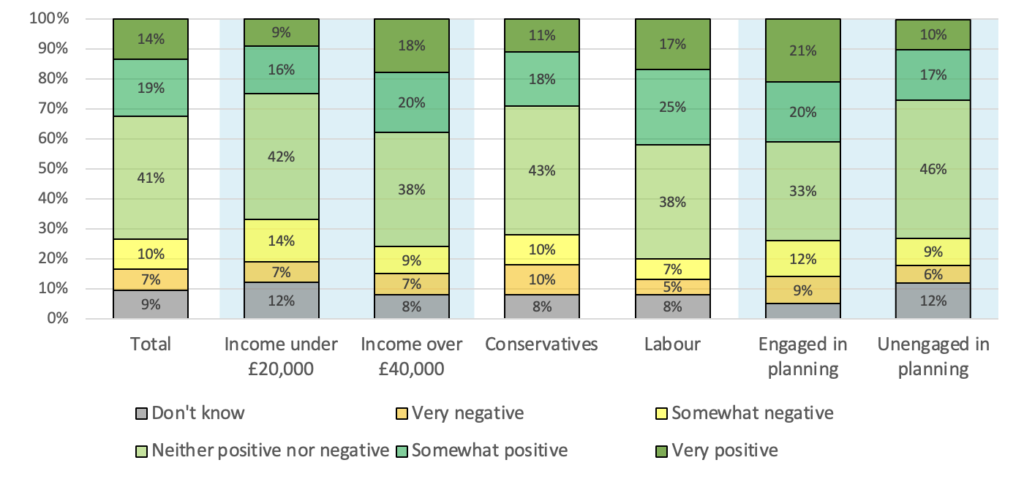
As can be seen in Chart 18 below, more of the UK public (33%) would either welcome – either ‘somewhat’ or ‘very’ – their neighbour installing a heat pump outside their home than have a net negative response to it (17%). However, a plurality of the public (41%) would have neither a positive nor a negative response.
Chart 18. Views of the public on an immediate neighbour installing a heat pump outside their home.
 Base: 2,194 UK adults; those with no neighbours have been excluded.
The most consistent disparity between respondents of different socio-demographic characteristics was between lower- and higher-income respondents, with those in higher-income households generally having a more positive view of their neighbours installing heat pumps. A plurality of both respondents in households earning under £20,000 (42%) and households earning over £40,000 (38%) had neither a positive nor a negative view of an immediate neighbour installing a heat pump outside their home, but those in households earning over £40,000 were twice as likely to have a very positive view of it (18%) as those in households earning under £20,000 (9%).
Worth noting is that there was also again disparity between differently-aged respondents. While a plurality across all age brackets had neither a positive nor a negative view of an immediate neighbour installing a heat pump outside their home, respondents aged 18 to 24 were equally likely to have a net negative view of their neighbour installing a heat pump outside their home as to have a net positive view of it (26%). The age bracket that would respond most positively to their neighbour installing a heat pump outside their home, however, is middle-aged respondents, with those aged 45 to 54 being 25 percentage points more likely to have a net positive view of it (36%) than a negative one (11%).
There was only limited variation in responses between those historically engaged and unengaged in the planning process. A plurality of both those engaged (33%) and unengaged (46%) in planning had neither a positive nor a negative view of an immediate neighbour installing a heat pump outside their home. Most notably, those engaged in planning were over twice as likely to have a very positive view of an immediate neighbour installing a heat pump outside their home, with 21% of them holding that view as compared to only 10% of those unengaged in planning.
2019 Conservative voters were also slightly less likely to have a positive view of their neighbour installing a heat pump. Again, a plurality among the voters of all parties had neither a positive nor a negative view of an immediate neighbour installing a heat pump outside their home – 42% for 2019 Conservative voters, 37% for 2019 Labour voters and 38% for 2019 Liberal Democrat voters – but 2019 Conservative voters were more likely to have a net negative view of it than the voters of other major parties. Only nine percentage points more Conservatives had a net positive view of it as compared to 30 percentage points more Labour voters and 39 percentage points more Liberal Democrat voters.
Last, we asked the UK public how they would feel if their immediate neighbour installed solar panels on the roof of their home.
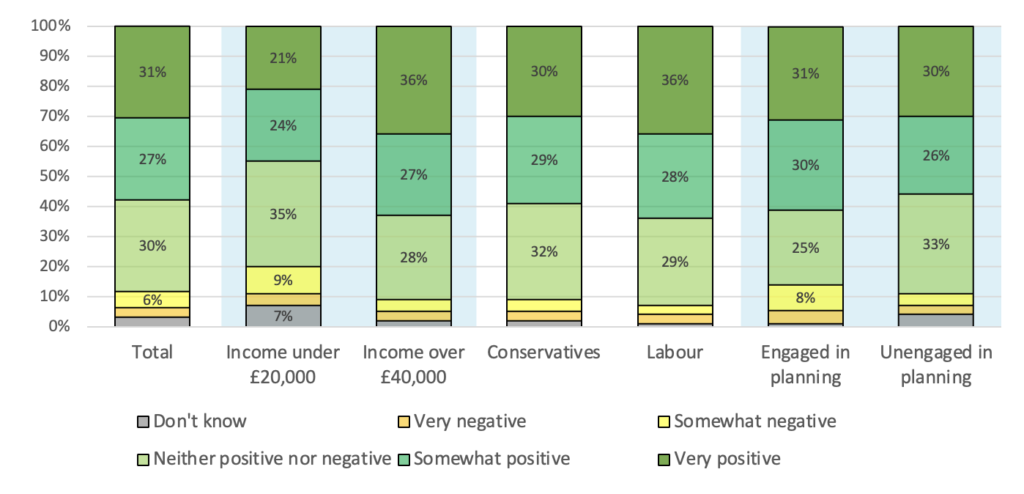
As can be seen in Chart 18 below, the UK public is even more positive about solar panels than heat pumps by their neighbours’ homes. A majority of the UK public (58%) would have a net positive – either ‘somewhat’ or ‘very – reaction to their neighbour installing solar panels. This is as opposed to only 8% who would have a net negative reaction.
Chart 19. Views of the public on an immediate neighbour installing solar panels on the roof of their home.
 Base: 2,192 UK adults; those with no neighbours have been excluded.
The most consistent disparity between respondents of different socio-demographic characteristics was again between lower- and higher-income respondents, with those in higher-income households generally having a more positive view of their neighbours installing solar panels. While a majority of respondents in households earning over £40,000 (63%) had a net positive view of a neighbour installing solar panels, this was true of only a plurality of respondents in households earning under £20,000 (45%).
While there was also again disparity between differently aged respondents, this time it was modest. Overall, 50% of 18-to-24-year-olds had a net positive view of their neighbour installing solar panels, as compared to 62% of 45-to-54-year-olds – the age bracket most positive about solar panel instalment.
Among political voting groups, there was little variation. Although a plurality of 2019 Conservative voters (32%) said that they had neither a positive nor a negative view of an immediate neighbour installing solar panels on the roof of their home, it is also the case that only 7% of 2019 Conservative voters had a net negative view of it, while 59% of them had a net positive view. This is as compared to 64% of 2019 Labour voters having a net positive of the solar panel instalment; the most common response among 2019 Labour voters (36%) was to have a very positive view of it.
Again, there was only limited variation in responses between those historically engaged and unengaged in the planning process. A majority of both those engaged (61%) and unengaged (56%) in planning had a net positive view of the instalment.

 Base: 2,243 UK adults.
 Base: 2,243 UK adults.
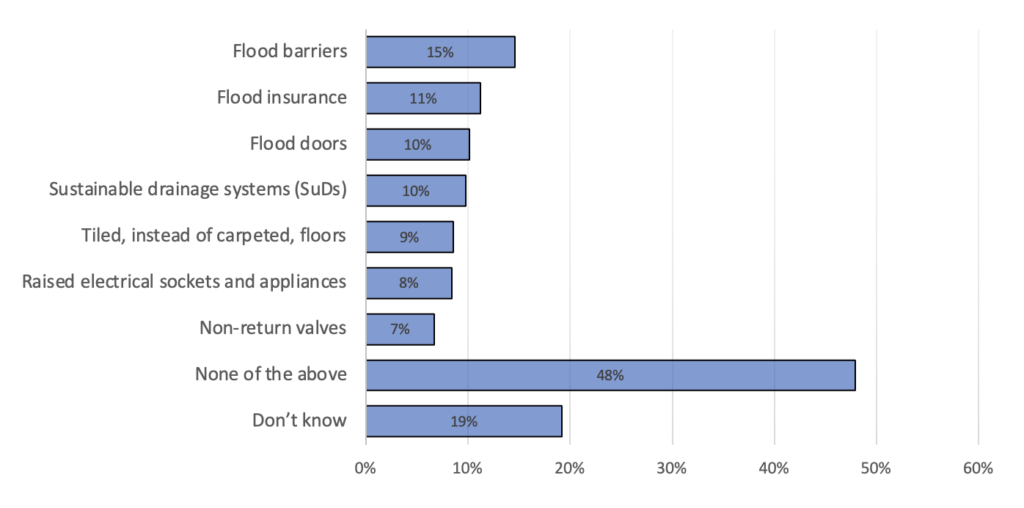 Base: 2,243 UK adults.
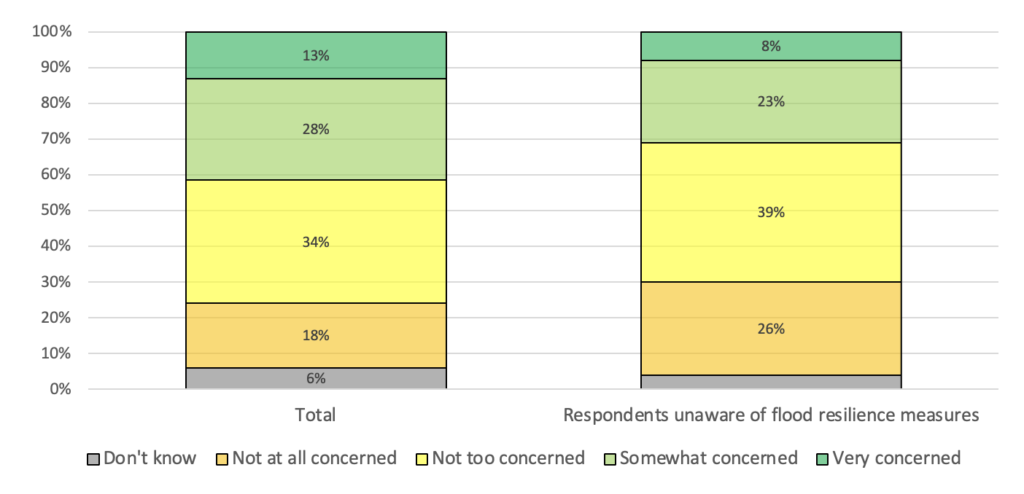 Base: 1,091 UK adults unaware of any flood resilience measures protecting their home or their local area.
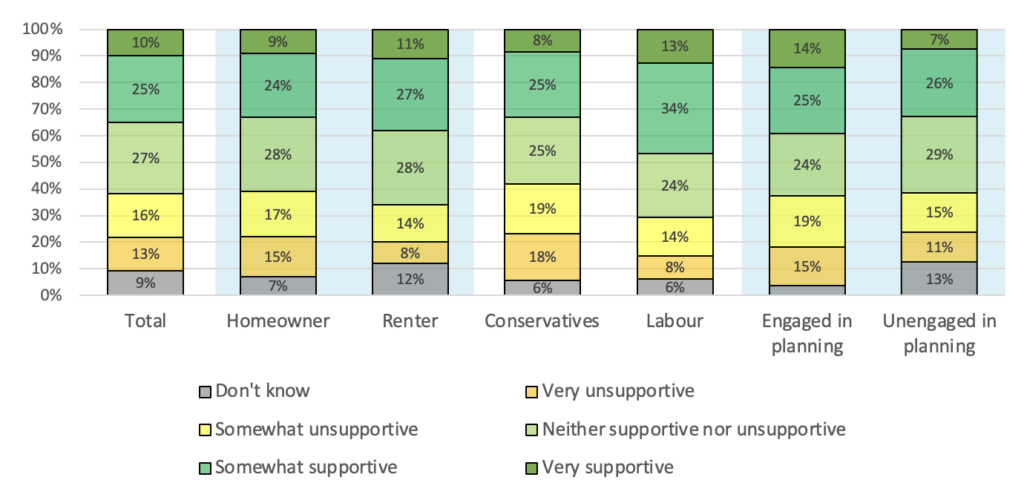 Base: 2,243 UK adults.
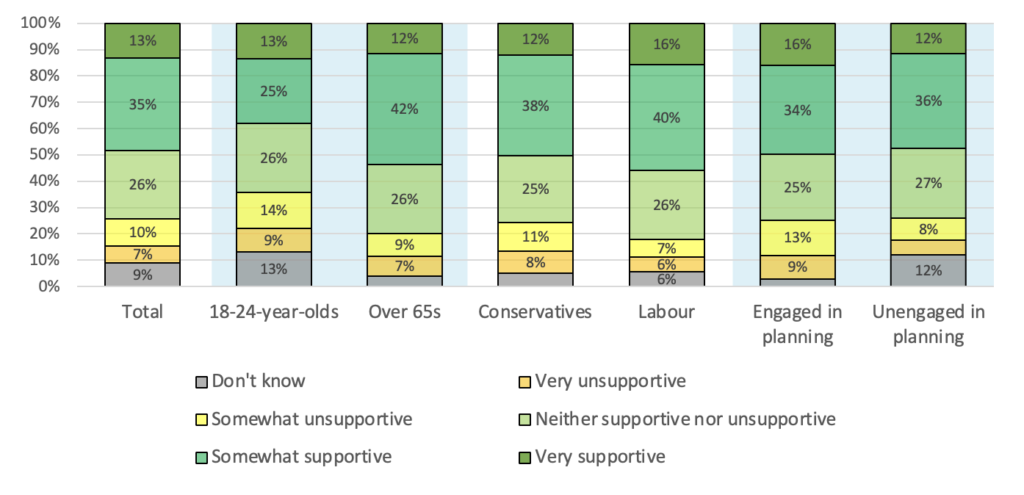 Base: 2,243 UK adults.
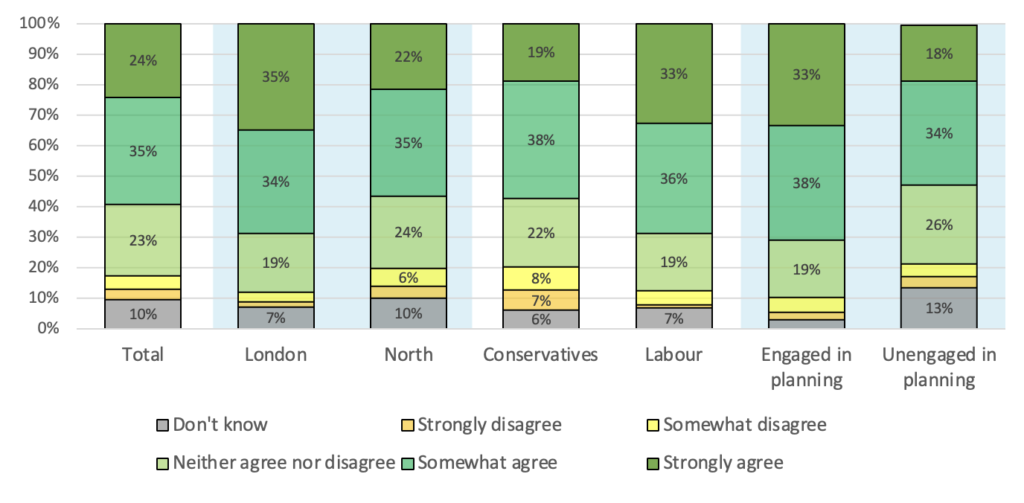 Base: 2,243 UK adults.
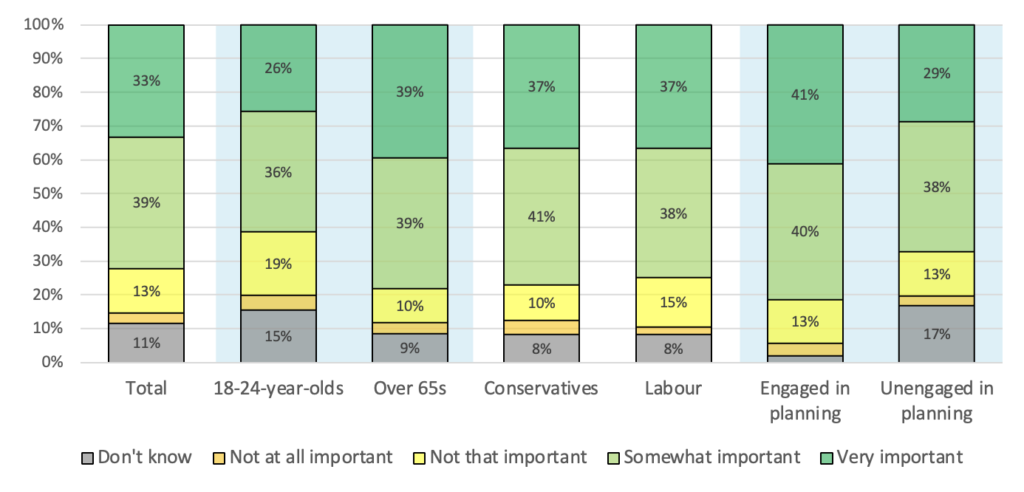 Base: 2,243 UK adults.
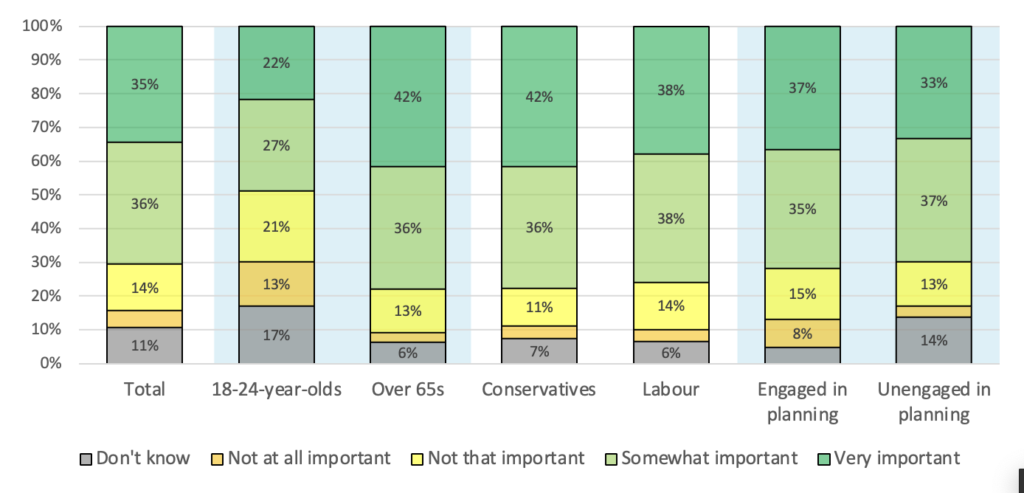 Base: 2,243 UK adults.
 Base: 2,243 UK adults.
  Base: 2,243 UK adults.
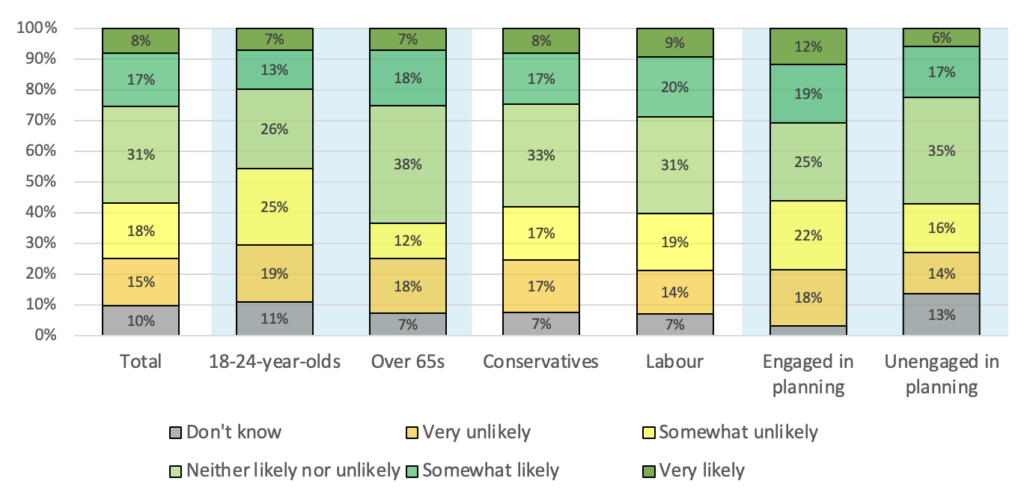 Base: 2,243 UK adults.
 Base: 2,243 UK adults.
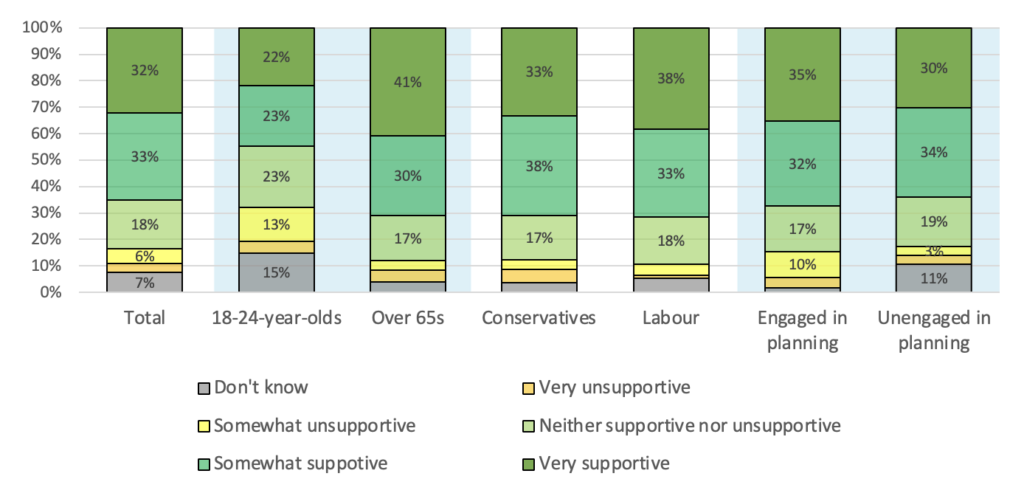 Base: 2,243 UK adults.


